Quality Of Life, Salaries, And Housing: The New Map Of Global Metropolises
| By Amaya Uriarte | 0 Comentarios

| By Amaya Uriarte | 0 Comentarios
| By Amaya Uriarte | 0 Comentarios

Infracapital, M&G’s infrastructure equity investment platform—integrated within its Private Markets division with £81 billion in assets under management—has appointed John Bruen as the firm’s new head. He will join on September 1 and report to Emmanuel Deblanc, Chief Investment Officer of Private Markets at M&G Investments.
According to the company, John brings over 25 years of international infrastructure investment experience. He joins from H.I.G. Capital where, as Managing Director and partner, he helped establish the firm’s infrastructure platform and raise its first value-add infrastructure fund, which reached $1.3 billion. He also possesses extensive experience investing in and managing portfolio companies across the infrastructure sector, having previously worked at Macquarie Asset Management and Ferrovial Airports.
He will succeed Martin Lennon, who is retiring after a career of more than 36 years in the industry. Since co-founding Infracapital in 2001, he led its growth into one of Europe’s leading middle-market infrastructure investors. Under his leadership, Infracapital raised over £9 billion across a series of dedicated funds investing in essential infrastructure across Europe, through public-private partnerships, brownfield infrastructure assets, and greenfield projects spanning energy, digital infrastructure, transport, and utilities.
Infracapital notes that at a time when Europe seeks to strengthen its energy security, accelerate decarbonization, drive digitalization, and foster economic growth, the company plays a prominent role in financing and developing the essential infrastructure on which communities and businesses rely.
“John is a highly respected leader in the infrastructure sector, with an outstanding track record in investing and building businesses. His combination of investment expertise and leadership capabilities, alongside his strong industry relationships, position him exceptionally well to lead Infracapital into its next phase of growth at a time when demand for investment in essential infrastructure continues to rise across Europe. I would like to thank Martin for his extraordinary contribution to the business over the past 28 years. Under his leadership, Infracapital has established itself as a trusted partner for both investors and portfolio companies, while playing a pivotal role in developing the infrastructure investment sector in Europe. Martin will remain actively involved during the leadership transition process, working closely with the team to ensure a smooth handover and continuity for clients and stakeholders,” highlighted Emmanuel Deblanc, CIO of Private Markets at M&G Investments.
For his part, John Bruen stated: “As demand for infrastructure continues to grow, driven by the energy transition, digitalization, and the need to modernize critical assets, the market presents significant long-term investment opportunities. Infracapital’s investment approach, deep sector expertise, and strong track record place it in a privileged position to capitalize on these structural trends. I am excited to work alongside the team to build on these strong foundations and continue generating value for our investors and stakeholders.”
“I am proud of what we have built at Infracapital over the past 25 years. Our success has been made possible thanks to the contributions of numerous highly talented professionals, both past and present, and the trust our clients have placed in us. Together, we have helped transform infrastructure investing from a niche strategy into an established asset class for institutional investors, and it has been a privilege to experience that evolution firsthand. I retire with peace of mind knowing that the firm is in an exceptionally strong position for the future,” added Martin Lennon regarding his departure from the firm.
| By Amaya Uriarte | 0 Comentarios

The US stock market broke all its trading records on October 8, 2025: according to SEC data, volume reached 6.26 million orders in that single session, making it the highest-volume trading day in history since data collection began in January 2012. In 2026, we could be on track to break that record (the US regulator only provides data through December 31, 2025), driven by the sharp spike in volatility brought about by the war between Iran and the United States, which has triggered severe periodic corrections. However, who is actually moving the equity markets? Have stock market dynamics changed? And, most importantly, how are active management firms adapting to this new reality?
“Twenty years ago, it was big asset managers who could engage in price discovery; they were the ones moving the market. But the market has changed a lot, and now it is retail investors and hedge funds setting the rules of the game, and we should admit it,” reflects Huseyin Turan, portfolio manager of the J Safra Sarasin Tech Disruptors fund at J. Safra Sarasin Sustainable Asset Management (JSS SAM). Various data sources confirm this manager’s impression.
According to Reuters data, retail investor flows into US equities reached record levels in 2025, topping $308 billion. This represents a 14% increase over the “meme stock” craze seen in 2021, when flows of $270 billion were recorded.
Citadel confirms the continuation of this trend in its first-half 2026 report on market structure and flows, noting that during May and June it recorded an average daily cash equity trading volume 65% higher than in 2025, and more than double the 2024 average: “Nine of the ten highest-activity trading days ever recorded on our platform took place in the last two months, including seven in the month of June alone.” In fact, they point out that June 12 registered the largest single-day net volume of retail investor purchases ever observed on the platform, exceeding the previous record by 50%. It is worth noting that Citadel is the number one market maker for retail investors in the US, executing approximately 35% of all retail orders.
One of the keys to this spectacular increase in trading relates to expanded access for retail investors who did not previously invest in the market; according to Citadel, 50% of lower-income US households—traditionally the least active investing segment—today hold more than $615 billion in stocks and mutual funds, an all-time high. Since 2010, participation in stocks and mutual funds among the bottom 50% of US households by purchasing power has grown by more than 570%, outstripping any other income group.
In late 2020, video game retailer GameStop was one of the most heavily shorted stocks on the US market. Everything changed following a post on a Reddit forum by a user arguing that the company was undervalued. Soon, other forum users began investing in GameStop, driven partly by this user’s thesis—US investor Keith Gill, known on the forum as @RoaringKitty or @DeepFuckingValue—but also guided by a mix of emotions, ranging from nostalgia for bygone days to defying Wall Street elites.
GameStop became the first documented meme stock in history: users began buying shares en masse, eventually triggering a short squeeze (hedge funds that had taken short positions were forced to unwind them and buy back shares to cover losses, driving the stock price up and triggering further short covers). As a result, the stock rose from trading at $1.50 per share to hitting highs of $81.25 in a matter of weeks.
Five years later, the company continues to trade at nearly 15 times above its lows and recently submitted a takeover bid for eBay that was rejected by the company. According to SEC filings, GameStop holds a 10% stake in eBay, suggesting this chapter is not yet closed.
GameStop is not the only example, though it remains the most iconic instance of these sharp speculative movements centered on individual stocks that suddenly capture all the headlines for a brief period. This behavior has also been labeled “dumb money” by various media outlets. Another high-profile case, which resulted in a regulatory probe, involved Elon Musk’s tweets recommending investments in the cryptocurrency Dogecoin.
For Hartwig Kos, Head of Multi Asset Allocation at Allianz Global Investors, the recent IPO of SpaceX was the latest major meme. In an interview with Funds Society, Kos explained that his team has started working on identifying “meme themes”: “You position yourself from a fundamental standpoint, but you must also keep in mind what the trending topics are in the market, because the weight of the retail investor is very significant today. Currently, it is a market largely dominated by ‘animal spirits,'” he detailed.
Kos and his team also track whether retail investors buy during steep downturns, a behavior termed “buy the dip.” Citadel’s report confirms that retail investors purchased nearly 3.5 times the average daily volume on days when the S&P 500 closed lower during the first half of 2026.
For Fabiana Fedeli, CIO of Equities, Multi-Asset, and Sustainability at M&G Investments, one of the major shifts in equities since COVID has been the rise in dispersion across stocks, sectors, and countries. She cited as an example that in 2025, the materials sector “was fantastic in Asian emerging markets and very mediocre across the rest of the world.”
During a media presentation at the firm’s London office, Fedeli stated: “Investors are becoming increasingly specific and idiosyncratic,” while noting that retail investor participation in markets has virtually doubled since 2019 and that today’s retail investors are far better informed than in the past thanks to broader access to diverse information sources, including social media.
The expert defended M&G’s active management approach based on fundamental analysis, though without ignoring these trends: thus, if one of the stocks they hold or have on their radar becomes a meme stock, the protocol is to review the fundamental thesis: “If we believe it is truly worth buying, we wait for that ‘meme’ trend to cause its price to plunge, and then we enter; or, if we hold that stock and the ‘meme’ trend is pushing it to levels we believe completely overvalue future earnings, then we sell it.” Fedeli emphasized that the firm does not seek to actively participate, because “narratives change too quickly.”
At JSS SAM, manager Huseyin Turan notes that, in the case of mega-cap stocks, retail investor speculation “is not going to move share prices all that much.” Turan, who identifies as an X user (formerly Twitter) and a reader of several blogs, explains regarding comments from such accounts: “We have learned many good things from some Substack bloggers, but we are very selective. I don’t believe they have the capacity to move share prices, but they can move the narrative or the debate surrounding a stock.”
However, attributing stock market dynamics simply to the more or less irrational behavior of retail investors means taking the part for the whole. Citadel’s own report speaks of 2026 as witnessing “the structural transformation of equity markets” and draws conclusions regarding the primary forces currently moving markets: “Concentration, passive investing, retail investor participation, leverage, and volatility are no longer independent trends. Together, they increasingly determine how capital flows, how prices are set, and how risk is transferred.”
Among this set of interconnected trends, the growing role of passive management is worth highlighting. According to ETFGI data compiled in its Global ETFs Industry Landscape Insights report, the global ETF sector reached a record $23.09 trillion in the first half of the year, with net inflows hitting an all-time high of $1.33 trillion.
From M&G, Fabiana Fedeli warns that this changing dynamic is in turn altering how institutional investors allocate capital: “We have a number of clients who have asked us to start moving some money from passive to active management in areas where we believe we can generate greater returns actively.” The expert offered the example that year to date, returns for the Magnificent Seven have ranged between 6% and 7%, whereas investing in the 300 largest constituents of the S&P 500 “would have yielded more than double.” “Forget index investing. Real alpha can be achieved through stock picking,” she asserted flatly.
Fedeli added that more sophisticated asset owners are also shifting their asset allocation, moving from a strategic asset allocation to what she described as a “total portfolio allocation”: while a traditional strategic allocation involves a series of asset blocks assigned different static weights, allocations in this new model are far more dynamic and unanchored from indexes, instead establishing absolute return targets tailored to investor needs. “It is a harder way to invest, but many of us are adapting gradually. Today’s reality is that we have moved away from passive investing and there is greater capacity to be more granular,” she concluded.
“We are in a momentum market: the more something rises, the more it tends to rise afterward. These markets are very lucrative because they capture major long-term trends, especially when leverage is involved… and we are currently at peak leverage levels,” says Víctor de la Morena, CIO of Amundi Iberia, clarifying that he was referring primarily to institutional money.
During an outlook presentation for the second half of the year in Madrid, De la Morena explained that this combination of momentum and leverage is helping investors multiply their gains during uptrends, “but it generates tremendous volatility, because when those trends break, the pullbacks are brutal.”
De la Morena warns that investors seem already “accustomed to this type of market” where large swings can occur—in fact, unprecedented levels of volatility are being recorded in the Nasdaq—yet this combination of momentum and leverage is creating “a great deal of distortion.”
Kriti Gupta, Global Investment Strategist at J.P. Morgan Private Banking, and Nick Roberts, portfolio manager, point out the obvious: today it is AI capturing all the momentum. “Investors are not only buying shares in companies adopting this technology, but are also capitalizing on scarcities related to its development. This includes GPUs, memory, networking equipment, power generation, grid infrastructure, cooling, transformers, copper, gas turbines, and data center capacity. This trend has come at the expense of enterprise software and commercial services.”
Both experts note that the outperformance of this winning group has been historic so far this year, pointing out that internal dispersion within the momentum factor is at its highest level since 1990: “While a basket of large-cap US non-AI stocks is up 3.5% this year, a basket tied to AI data centers has generated a 47% return. The benchmark MSCI USA Momentum Index has risen 43% since the S&P 500’s trough on March 30, representing a rally more than double that of the broader index,” they note.
The latest test for this dynamic lies in the IPOs announced for this year. SpaceX’s successful debut has already brought an extra influx of demand, although De la Morena points out that “since the year 2000, no entity had demanded so much money from the market.” The expert stressed the need to monitor these “market tests” very closely to determine “to what extent that appetite reflects tangible investment rather than speculation.”
Regarding the IPOs announced for after the summer—Anthropic and OpenAI—De la Morena concludes with this warning: “What lies ahead could be an avalanche of capital, and that money has to come from somewhere: either it exits other assets, or it comes from liquidity and savings… or credit is extended to fund it.”
| By Amaya Uriarte | 0 Comentarios

The largest banking integration carried out since the 2008 financial crisis is entering its final stretch. However, beyond the operational success of the Credit Suisse absorption, UBS’s second-quarter results conveyed another, far-reaching message for the global financial industry: the wealth management business continues to consolidate its position as the single most critical source of growth for major international banks.
According to its financial report, during the second quarter of 2026, UBS reported net profit of $2.8 billion and pre-tax profit of $3.6 billion, while underlying profit rose to $3.9 billion—a 45% increase compared to the prior-year period. Revenues grew by 13%, driven by solid performance across virtually all divisions.
Nevertheless, the metric observed most closely by the wealth management industry was altogether different. The Global Wealth Management division successfully attracted $36 billion in net new assets during the quarter, bringing the total to $73 billion for the first half of the year—a clear signal that the firm continues to capture wealth from high-net-worth clients even after integrating the vast majority of Credit Suisse’s legacy business.
As a result, total invested assets managed across the entire group reached a record high of $7.3 trillion, a figure that cements UBS’s position among the largest wealth managers globally.
During the earnings call, executive management highlighted that growth was particularly robust in the Americas and Asia—regions where the high-net-worth population continues to expand and where demand for specialized financial advice maintains a structural upward trajectory.
In this context, client transaction revenues within the wealth management unit grew 23% year-over-year, reflecting heightened investment activity propelled by more dynamic financial markets and a renewed risk appetite throughout much of the quarter.
The combination of new inflows, higher advisory fees, and a favorable investment environment reinforces a trend recently mirrored by other financial titans such as BlackRock, Vanguard, Morgan Stanley, and JPMorgan: competition no longer centers merely on selling financial products, but on managing long-term relationships with increasingly wealthy and sophisticated clients.
Just three years ago, UBS faced the formidable challenge of absorbing Credit Suisse following the latter’s collapse. Today, that process is virtually ceasing to be a source of uncertainty. The institution reported that over 90% of legacy technology applications have been decommissioned and nearly 70% completely decommissioned, while cumulative synergies have reached $12 billion in gross cost savings—nearing the target of $13.5 billion slated for year-end.
For investors, this signals that the bank can once again pivot toward growth rather than integration. The results also underscore how the business model of major international banks has evolved. While traditional lending activities face compressed margins and heightened regulatory burdens, wealth management offers recurring revenues, lower capital requirements, and client relationships that frequently span decades.
In UBS’s case, Global Wealth Management generated revenues of $7.1 billion—approximately half of the group’s total top-line revenue—consolidating its role as the bank’s primary growth engine.
Furthermore, this financial strength enabled UBS to announce a new $3 billion share buyback program, of which at least $1 billion is slated for execution over the coming months—though the pace of execution will also depend on forthcoming capital rules being discussed by Swiss regulators in the wake of Credit Suisse’s collapse.
For the global wealth management industry, UBS’s results yield an important conclusion. The Credit Suisse integration is fading as the central talking point. In its place emerges a structural reality: wealth creation continues to expand, high-net-worth individuals remain in pursuit of specialized advice, and institutions with global scale are the primary beneficiaries of this shift.
If a decade ago the race was to become the largest bank, today the competition appears concentrated on managing the largest possible pool of private wealth. And, for now, UBS is demonstrating that this strategy continues to pay off.
| By Amaya Uriarte | 0 Comentarios

Invesco has published its Alternative Opportunities Outlook report for the second half of 2026, analyzing the outlook for major private markets and alternative strategies. Following a first half marked by geopolitical uncertainty, interest rates that remain at elevated levels, and a gradual recovery in corporate activity, the asset manager considers that select alternative investments continue to present attractive opportunities for income generation, portfolio diversification, and exposure to structural growth trends.
Although the macroeconomic environment remains constrained by the trajectory of inflation and geopolitical tensions, Invesco believes that improving financial conditions and strong private sector balance sheets support a constructive outlook for specific strategies within private markets.
“Following several years of adjustment, we are beginning to observe a more favorable environment for select alternative investment strategies. Interest rates continue to support the appeal of private credit, while the gradual recovery in corporate activity and the stabilization of valuations are starting to generate new opportunities for long-term investors,” noted Fernando Fernández-Bravo, Head of Active Distribution Iberia at Invesco.
The Invesco Solutions & Custom Strategies team identifies four core areas of opportunity for the second half of the year: private credit, real assets, private equity, and hedge funds.
Private Credit: Invesco maintains a favorable stance on private credit, particularly in direct lending and real estate credit. High interest rates continue to drive attractive yields, while the gradual recovery in M&A activity and significant dry powder held by private equity support greater dynamism in corporate financing. In this context, the firm considers that the middle-market segment continues to offer compelling risk-adjusted returns.
Real Assets: The manager holds a positive view on infrastructure and real estate. In the real estate market, valuations are approaching a point of stabilization, favoring segments capable of generating recurring income and stronger downside protection. In infrastructure, the outlook remains backed by structural tailwinds such as digitalization, data center expansion, the development of artificial intelligence, and growing investment requirements for energy grids and the energy transition.
Private Equity: While Invesco maintains a prudent approach to private equity, it notes a gradual improvement in the environment for select strategies. The recovery in corporate activity and more realistic valuations are creating selective opportunities, particularly in growth equity, secondary transactions, and private companies with solid fundamentals.
Hedge Funds: In a climate where uncertainties surrounding economic growth, inflation, and monetary policy persist, Invesco views hedge funds as continuing to play a vital role as a diversification tool. The firm maintains its preference for arbitrage, event-driven, and systematic strategies, which have historically performed well in environments characterized by high volatility and elevated interest rates.
Overall, Invesco considers that the current environment continues to favor a diversified approach to alternative assets. Private credit remains the primary source of income generation within private markets, while real assets provide access to long-term structural trends, and hedge funds can help reinforce portfolio resilience in a landscape that is expected to remain defined by uncertainty.
| By Amaya Uriarte | 0 Comentarios

Janus Henderson has entered into a strategic partnership with Insignia Financial Ltd (Insignia), one of Australia’s leading wealth management providers. The transaction includes the acquisition of three specialized investment managers: Antares Fixed Income, Antares Equities, and Fairview Equity Partners.
The three firms manage approximately AUD 33 billion in Australian fixed income, large-cap equities, and small-cap equities, “significantly reinforcing Janus Henderson’s commitment to Australia and expanding its local investment capabilities,” according to the asset manager. Furthermore, the client base is predominantly institutional—encompassing both Insignia mandates and third-party institutional clients—while also featuring a range of well-established retail investment strategies.
Upon completion of the transaction, Antares Fixed Income will integrate into Janus Henderson’s existing Australian fixed income team, creating one of the largest dedicated fixed income offerings in the local market. Antares Equities will join Janus Henderson’s global equity business, continuing to offer Australian large-cap equities to institutional and retail clients.
Meanwhile, Fairview Equity Partners—in which Janus Henderson will acquire Insignia’s 40% stake—will continue to operate independently as a specialized boutique manager focused on Australian small-cap equities.
The transaction reinforces a long-term strategic partnership between Janus Henderson and Insignia, through which Janus Henderson will provide a broad suite of its global investment capabilities to Insignia’s investment solutions. The alliance supports Insignia’s objective of delivering scalable, cost-effective investment solutions for its members and clients, while providing both firms with a foundation for long-term growth.
According to the asset manager, the transaction aligns with Janus Henderson’s overarching strategy to partner with major institutional clients and scale its existing capabilities in high-demand areas. Additionally, it advances its strategic priorities by consolidating its core business in Australia and diversifying its capabilities through the addition of investment teams with established track records.
“We are excited to announce this partnership with Insignia, which significantly strengthens our presence in Australia and reflects our long-term commitment to a market of strategic importance for the firm. By combining the acquisition of established investment teams with a long-term partnership, we deepen our relationship with a leading wealth manager and expand the capabilities we offer to our clients,” said Ali Dibadj, Chief Executive Officer (CEO) of Janus Henderson.
Garry Mulcahy, CEO of Asset Management at Insignia Financial, added: “We are delighted to enhance our strategic partnership with Janus Henderson. Combining Janus Henderson’s global investment capabilities with the expertise of the Antares and Fairview teams establishes a strong foundation for future growth in the Australian market. We have a long-standing relationship with Janus Henderson and look forward to continuing our work with such a high-caliber global investment firm.”
The financial terms of the transaction were not disclosed. Closing is expected to occur in the fourth quarter of 2026, subject to customary closing conditions, including regulatory approval.
| By Beltrán | 0 Comentarios

Andersen Iberia has launched the Miami Hub, a strategic base through which the firm will coordinate advice for Latin American, Spanish, and international clients—including high-net-worth individuals, family businesses, investors, and corporations—with business interests spanning Spain, Latin America, the United States, and other markets.
With this initiative, Andersen Iberia reinforces its positioning as a strategic partner for clients operating internationally, drawing on its experience in cross-border transactions and the coordination of specialized teams in tax, wealth planning, real estate investment, family enterprise, and business law.
José Vicente Morote, Managing Partner of Andersen Iberia, emphasized that this opening comes in response to growing demand from the firm’s clients: “An increasing number of companies and high-net-worth individuals are asking us for advice that isn’t limited to a single jurisdiction, but rather understands their operations, tax position, and legal risks across different countries from a global perspective. With the Miami Hub, we respond to that need by offering a physical and operational benchmark that strengthens our value proposition as an integrated firm.”
The Miami Hub is led by Jorge Martínez Alemán, Counsel at Andersen, who brings a solid track record in tax and wealth advisory for family businesses and high-net-worth individuals. Holding a degree in Business Administration and Management from the University of Valencia, he completed his training with a Master’s in Taxation and a Master’s in International Taxation at the CEF (Center for Financial Studies). Beyond his specialization in international tax law, he holds extensive experience in real estate transactions in Spain and tax planning for athletes. Ranked by the Chambers High Net Worth guide for 2023, 2024, and 2025, he is an active member of the Spain-United States Chamber of Commerce in Miami, Florida.
Andersen’s Miami Hub provides companies, investors, and family offices with interests in Europe, Latin America, and the United States with coordinated advisory services that combine business vision, technical expertise, and international reach.
As highlighted by the firm, when a matter requires it, the Miami Hub will work in close coordination with local teams and advisors, thereby ensuring a tailored response to the specific needs of each transaction and jurisdiction. To achieve this, it relies on the backing of Andersen Iberia’s teams in Spain and Portugal, allowing it to offer deep knowledge of the legal, regulatory, and tax frameworks applicable to transatlantic operations.
Added to this is the know-how of Andersen Global, which boasts a presence in 185 countries and over 50,000 professionals worldwide. Specifically, in Latin America, the firm operates in 18 countries, while in the U.S. it has 30 offices and 2,500 professionals.
In this way, the Miami Hub supports clients in structuring and executing cross-border investments, corporate transactions, and wealth management projects—helping identify opportunities, anticipate risks, and provide the legal certainty required for decision-making in an increasingly complex global environment.
| By Amaya Uriarte | 0 Comentarios

Ardian, the global private markets investment firm, has announced the signing of a share purchase agreement under which Assurances du Crédit Mutuel (ACM) and Wafra, two existing shareholders in its capital, will increase their respective stakes in the company. As part of this transaction, AXA will sell its 10% holding in Ardian, subject to customary closing conditions and regulatory approvals.
Following this investment, ACM’s stake in Ardian will rise to 23%, while Wafra will also expand its investment after acquiring an initial minority stake in 2025. Both shareholders will increase their positions by exercising pre-emption rights available to them as existing shareholders. Meanwhile, Ardian’s employees will remain the primary shareholder group, controlling approximately 40% of the firm’s capital.
Concurrently, AXA will continue its long-standing relationship with Ardian as one of the primary investors in its funds. The transaction is expected to close between late 2026 and early 2027.
“AXA has been our partner since day one, when Claude Bébéar asked me to create a private equity firm in 1996 and Ardian—then AXA Private Equity—was born. I am delighted to see that this 30-year partnership will continue to strengthen through AXA’s renewed trust in our strategy through its investments as a client, alongside the growing support of our diversified international shareholder base,” explained Dominique Senequier, founder and CEO of Ardian.
Mark Benedetti, co-CEO of Ardian, highlighted: “Opportunities to acquire shares in Ardian arise very rarely, and demand consistently exceeds supply. The increased stakes from ACM and Wafra, together with AXA’s ongoing commitment as one of our major clients, represent a strong endorsement of the business we have built over the past three decades and our current position as a global investment firm with $200 billion in assets under management. We look forward to continuing to create sustainable value for all of our shareholders.”
Finally, Patrick Thomas, Chairman of the Supervisory Committee at Ardian, added: “We are pleased to see the continued commitment of our existing shareholders through this agreement. The transaction further strengthens our international shareholder base while preserving the long-term governance model and corporate culture that remain the foundation of Ardian’s success.”
| By Amaya Uriarte | 0 Comentarios

The reactivation of the naval blockade and the sudden escalation of military tension in the Strait of Hormuz have shattered expectations of a short-term agreement with Iran, immediately rattling financial and institutional markets. According to the latest Middle East Weekly Tracker report published by Natixis Corporate and Investment Banking (CIB) and authored by economists Alicia García Herrero and Jeremy Ji, the surge in war risk is already translating into sharp upward pressure on oil, widespread losses across Gulf equities, and rising sovereign risk premiums.
Impact on Equities and Institutional Investment Flows
Gulf Cooperation Council (GCC) stock markets have reacted downward to the return of geopolitical uncertainty. Dubai equities in particular recorded a decline of around 1.5% in the week prior to July 15, penalized by their high commercial, tourism, and financial exposure to physical disruptions in the Strait.
Furthermore, the Natixis CIB report notes a detrimental shift in cross-border capital behavior. As stated in their report: “Foreign flows remained mildly negative, with a net outflow of $11 million from Dubai and Saudi equity markets last week. With the blockade back, these capital outflows are more likely to increase rather than reverse.”
Crude at $85 and Stress in Credit Markets (CDS)
The paralysis of this key maritime route for international trade has driven commodities significantly higher. Brent crude futures scaled to $85 per barrel on July 16, reacting to the U.S. Navy’s re-establishment of the blockade on Iranian ports and the closure of Hormuz decreed by Iran’s Islamic Revolutionary Guard Corps (IRGC).
In the fixed income and credit derivatives markets, 5-year Credit Default Swap (CDS) spreads for GCC nations have widened noticeably. Analysts at the French institution highlight that Bahrain continues to be the sovereign adjusting upward most rapidly—increasing its cost of hedging against default—due to its status as host to U.S. bases, which directly exposes it to absorbing Iranian retaliation.
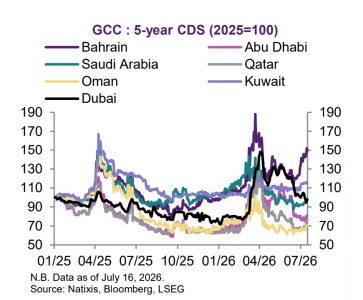
Graph taken from the Natixis Report. Source: Natixis, Bloomberg, and LSEG
Activity Collapse in the Real Economy
The physical impact of the conflict is already fully quantifiable in freight transport data compiled by Natixis. Daily vessel traffic through the Strait of Hormuz has suffered a severe collapse, plummeting to just 12 commercial ships on July 13, compared to the 25 recorded barely a week earlier. Conversely, scheduled and monitored flights at Dubai and Doha airports show minimal variation, confirming that, for now, direct economic damage remains almost exclusively concentrated in maritime transport.
The report details a succession of critical events occurring between July 11 and July 16, 2026, including direct attacks on United Arab Emirates tankers and targeted bombardments by allied forces. For the firm, political resistance to withdrawing troops from conflict zones and the lack of consensus over the control of shipping routes will keep any definitive short-term agreement completely stalled, shaping a volatile landscape that global fund managers and emerging market investors will need to monitor closely in the coming weeks.
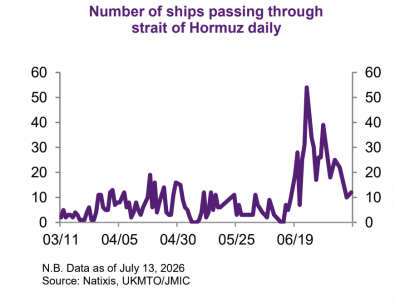
Graph taken from the Natixis Report. Source: Natixis
| By Amaya Uriarte | 0 Comentarios

AEW, an affiliate of Natixis IM, has announced the appointment of Bianca Kraus as Head of Investor Relations Europe, effective July 1, 2026. Bianca is based in Munich and will report to Vanessa Roux-Collet, Chief Executive Officer (CEO) of AEW in Europe.
As highlighted by the firm, Bianca joined AEW in 2019 as Head of Investor Relations for Germany, and since 2023 she has been leading the company’s investor relations for the entire DACH region, where she was responsible for building and maintaining relationships with institutional investors and consultants in Germany, Austria, and German-speaking Switzerland. Bianca has raised capital for AEW’s global platform, securing segregated account mandates on behalf of institutional investors and raising capital for the manager’s flagship funds.
In her new role, Bianca will lead AEW’s European investor relations team, supervising capital raising and client servicing for the firm across Europe. Bianca will work in close collaboration with Vanessa Roux-Collet to execute AEW’s European growth strategy, while ensuring continuity of service for existing clients.
Bianca joined AEW from BNP Paribas REIM Germany, where she served as Head of Client and Fund Relations, and brings nearly 30 years of experience in real estate investment management, having spent the last fifteen years in executive roles within investor relations.
Vanessa Roux-Collet, CEO of AEW in Europe, commented that investor relations are an integral part of their business strategy and that Bianca has played a fundamental role in creating and consolidating strong relationships with institutional investor clients over the last seven years. She noted that Bianca’s promotion to Head of Investor Relations Europe is a natural step, and expressed enthusiasm for working with her to ensure continued exemplary client service and to focus on growing the business.
Bianca Kraus, Head of Investor Relations Europe at AEW, added that after leading AEW’s investor relations in the DACH region over recent years, she is excited to expand her responsibilities across Europe alongside their top-tier team. She stated that the firm has a clear growth strategy that leverages expertise across key conviction themes where they possess deep knowledge and can offer clients attractive investment opportunities.