Treasuries, oil, and private credit have dominated attention over the weekend, reminding investors that we are in a year marked by uncertainty, by the weight of geopolitics, and by sensitivity to liquidity, but above all by the market’s ability to digest this context.
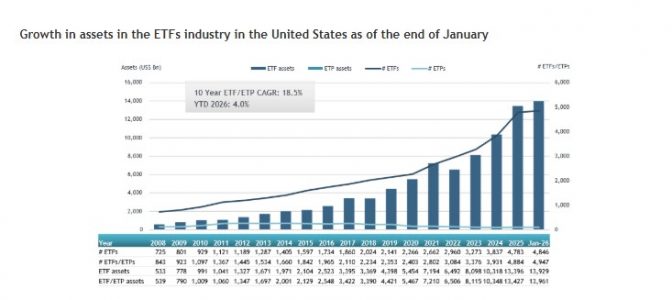
Javier Molina, Market Analyst at eToro, believes that we are facing “a latent risk in a complacent market.” According to his view, we are at a delicate point in the cycle, although the surface of the market does not yet clearly reflect it. “When you connect the dots, labor data, gold behavior, aggregate valuations, flows, and credit, a much more complex picture begins to emerge than the dominant optimistic tone suggests. Although macro noise is beginning to accumulate, the market is not reacting with fear. Inflows into equity funds and ETFs continue, week after week. But when you look more closely, the story changes. The bulk of flows is not going aggressively into equities. It is going into credit. Into corporate fixed income, into instruments that offer returns via ‘yield’ with lower relative volatility. In other words, money is not decisively increasing its bet on beta, but rather prioritizing carry and quality,” explains Molina.
Message for the Investor
At PIMCO, they agree that markets can appear calm, even when vulnerabilities are accumulating beneath the surface. In fact, traditional volatility measures, such as the VIX and the MOVE index, may signal complacency in both equity and fixed income markets, even in situations of rising risk.
“Investors have enjoyed a bull market in equities that has lasted for years, driven largely by technology. But as AI continues to revolutionize industries and the broader economy, the stock market volatility observed in recent days, especially in technology-related sectors, demonstrates how uncertain the outlook remains,” note Marc Seidner, Chief Investment Officer of Non-Traditional Strategies at PIMCO, and Pramol Dhawan, Head of the Emerging Markets Portfolio Management Team at PIMCO.
In this context, their message to investors is clear: expect the unexpected. For both experts, 2026 requires an agile mindset prepared for uncertainty:
“Be prudent and disciplined with valuations. U.S. equity valuations still appear elevated, leaving little room for error and increasing susceptibility to sudden fluctuations. Be alert to signs of market complacency and make greater use of relative value strategies rather than directional bets. Also maintain flexibility across regions, not just sectors, with the ability to move capital decisively and find value, especially when attractive yields are available in many countries. And finally, be agile enough to react quickly when volatility creates dislocations, whether in Japanese government bonds, U.S. agency MBS, or emerging market sovereign bonds, leveraging global scale and local presence to identify opportunities.”
Trade Policy: A Blow to Trump’s Tariffs
Taking quick stock of what the past 72 hours mean for investors, the first issue to mention is that the U.S. Supreme Court ruled against the Administration by 6 votes to 3, finding that the use of the International Emergency Economic Powers Act (IEEPA) to impose tariffs is unlawful. Consequently, President Trump expressed his disagreement with the decision, calling it “deeply disappointing” and labeling the justices who supported it as “unpatriotic.” He also announced that he would resort to all possible laws to impose a new global levy. “Overall, the decision on tariffs does not alter our positive view on financial markets. The decision is slightly favorable for equities insofar as a lower tariff rate improves household purchasing power, limits inflation concerns, and supports further rate cuts by the Fed,” says Mark Haefele, CIO of UBS Global Wealth Management.
Following the announcement, U.S. equities reacted positively to the decision: the S&P 500 rose 0.7% and the tech-heavy Nasdaq advanced 0.9% immediately after the ruling. However, as experts at Bloomberg highlight, the Supreme Court’s decision affected the U.S. bond market, valued at 30 trillion dollars, by threatening to increase the government’s budget deficit and cause further damage to an economy already grappling with elevated inflation and unemployment. The issue is that the U.S. government could face more than 175 billion dollars in claims if the ruling leads to refunds.
According to the firm’s experts, although Trump said he would approve a new 10% global tariff to replace those he has just lost, the long-term outlook remained unclear, given that the legal provisions he invoked contemplate temporary levies.
On the matter, Jack Janasiewicz, Portfolio Manager at Natixis IM Solutions, notes that with the midterm elections in November, affordability has come to the forefront, and the time required to implement alternative tariffs could allow for some price relief in the meantime.
“That said, we do not expect U.S. companies to suddenly reverse the price increases that have already been implemented. Rather, we expect companies to hold firm, allowing the decline in tariff-related costs to help bolster margins in the meantime. The bigger issue revolves around the prospects for issuing refunds, which complicates the situation and raises many more questions that need answers. Until we have greater clarity on this, we can expect the Treasury market to experience a slight bearish steepening and marginal weakness in the U.S. dollar,” argues Janasiewicz.
Geopolitics: Iran and Oil
The geopolitical situation in the Middle East remains a hot topic. Last week saw a massive redeployment of U.S. forces to the region and harsh rhetoric toward Iran. This move comes as Iran’s Supreme Leader threatens to sink U.S. warships and joint naval exercises between Russia, China, and Iran have been announced in the Strait of Hormuz. Consequently, some voices suggest that the Trump administration may be close to launching a large-scale military campaign against Iran, exceeding previous operations in scope.
“Geopolitical tensions remained elevated in January amid concerns that the West might launch possible military strikes against Iran. This news flow exerted some upward pressure on oil prices and helped reinforce the reflation narrative,” says Cristina Matti, Head of European Small & Mid Cap Equities at Amundi.
Undoubtedly, the conflict with Iran dominates the oil market, and prices are inflated with a considerable geopolitical risk premium. In the view of Norbert Rücker, Head of Economics and Next Generation Research at Julius Baer, a military confrontation seems inevitable, but such an escalation does not necessarily entail a disruption of oil supply, as recent years have repeatedly demonstrated. “More importantly, today’s oil market is very resilient on the supply side, thanks to ample storage, production exceeding consumption, and spare production capacity. While we are not certain whether the current rally will peak at 70 or 80 dollars, we are more confident that the risk premium will decline and oil prices will return below 60 dollars by midyear. Amid the current geopolitics, we maintain our neutral view,” acknowledges Rücker.
Private Credit and Liquidity
In the private markets sphere, the siren songs are led by Blue Owl, one of the largest private credit firms, which has carried out significant sales of private credit assets worth around 1.4 billion dollars as part of its response to liquidity tensions and investor redemption pressures. According to the asset manager, the assets sold consist primarily of direct lending loans originated by the firm and sold to large institutional investors such as public pension funds and insurers, but the market interpreted the episode as a sign of liquidity risk in retail-oriented products.
Analysts highlight that this event has had repercussions in the market on three fronts: the drop in Blue Owl’s share price and the temporary contagion to other similar firms such as Ares, Apollo, Blackstone, KKR, and TPG; in the BDC universe, the episode reinforced fears that, in the face of further redemptions, funds may have to sell assets or activate limits, which typically translates into discounts and weaker sentiment; and finally, it brought back to the forefront the debate about private credit’s exposure to software/IT services.
When assessing how all this will affect private credit’s outlook, Gregory Ward, Deputy Head of Global Product Management and Private Credit Chief Investment Officer, and Chris Gudmastad, Head of Private Credit at Loomis Sayles (affiliate of Natixis IM), believe that capital spending related to artificial intelligence and technology will offer attractive opportunities for the private credit market. “In our view, increased M&A activity and strategic investment in growth should also drive a more diverse set of investment opportunities. Strong investor demand should persist, fueled by the rise of investors attracted to less mature areas of private credit (e.g., ABFs) and new non-institutional sources of capital that are emerging,” they state.
Finally, they conclude by highlighting several risks to watch this year, such as “increased competition among lenders, which could lead to yield compression and more aggressive deal structures,” or “macroeconomic uncertainty, such as interest rate volatility or a slowdown in economic growth, which may expose weaker borrowers and potentially result in higher default rates.”