The War in Iran and the El Niño Phenomenon Transform the Agricultural Commodities Market

  |   By  |  0 Comentarios

Canva

The Center for Climate Prediction of the National Oceanic and Atmospheric Administration (NOAA) maintained an advisory on the El Niño phenomenon and stated that it is intensifying, with a probability exceeding 90% that a very intense episode will occur during the autumn and winter of the Northern Hemisphere in 2026-27. The starting point for any outlook on the agricultural market facing 2027 is that meteorological agencies have reached a consensus, and have done so with unusual certainty.

The World Meteorological Organization reached the same conclusion on September 3, indicating a probability close to 100% that El Niño will persist during the periods from September to November 2026 and from December to February 2027, with the forecast that the phenomenon will reach a very strong intensity before reaching its peak toward the end of the year. Monitoring data from the Australian Bureau of Meteorology agree: the so-called relative El Niño 3.4 index reached +2.51 °C in the week ending September 13, compared to an El Niño threshold of +0.80 °C, while most models indicate that a maximum exceeding +3.0 °C will be reached and it is forecast that the phenomenon will persist until the autumn of 2027.
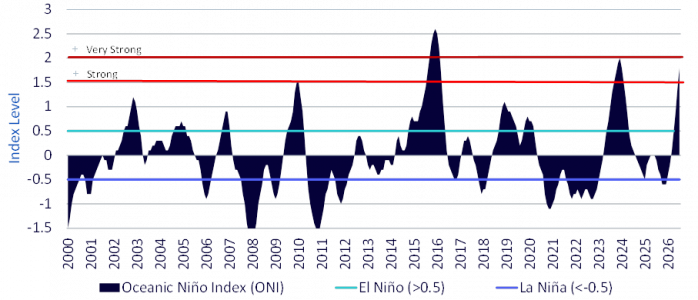
Oceanic Niño Index (ONI), from 2000 to Present. Source: National Oceanic and Atmospheric Administration (NOAA), Bloomberg Finance L.P. and WisdomTree, as of July 31, 2026.

The effects of El Niño on agriculture occur with a delay of between six and twelve months relative to the peak, due to the time it takes for atmospheric changes to modify local climate, affect crop cycles and impact global supply chains. Therefore, an event that reaches its peak at the end of the year impacts more directly the 2026/27 crops that are currently being sown or prepared: the Southern Hemisphere summer harvest, India’s Rabi season, West Africa’s main harvest, and Southeast Asia’s oil palm and robusta coffee cycles. The price impacts of what is happening in the Pacific will be felt mainly starting in 2027.

The Gulf Conflict Has Shifted from Focusing on Energy to Being a Matter of Inputs

The Gulf conflict has lasted seven months now and, instead of stabilizing, it has escalated. The ceasefire agreed upon in April and the memorandum of understanding signed in June were rendered ineffective when hostilities resumed in July. The recent event with the greatest impact took place on September 11, when Saudi Arabia closed its 1,200-kilometer east-west pipeline following a drone attack, which meant the closure of the main route by which Gulf crude bypasses the Strait of Hormuz.

In the agricultural sector, main exposure derives from the trade of fertilizers and raw materials transiting through the same waterway, and it is precisely the difference compared to 2022 that makes it lasting. The war between Russia and Ukraine in 2022 diverted trade flows, whereas this one has diminished productive capacity. It is estimated that 31 ammonia plants across the Middle East have been directly affected or closed down completely; another 49 in South Asia have reduced production or are halted due to raw material shortages; and at least 20 Russian plants have suffered damage due to drone attacks.

Their reactivation will require time and capital far beyond the end of hostilities. Persian Gulf countries account for approximately 43% of seaborne urea exports and 44% of seaborne sulfur trade. Even in the United States, which obtains two-thirds of both its urea and phosphate from the domestic market, 12% of the urea supply and 17% of DAP/MAP (diammonium phosphate/monoammonium phosphate) comes from beyond the Strait. This points to a capacity constraint extending across several seasons, rather than a freight transport issue.

Grains: A Group of Annual Crops That Already Carries a Risk Premium

The energy sector has recorded the largest individual variations of the year 2026, and refined products and crude oil occupy four of the top five spots. However, what is most revealing about the year-to-date performance table is the breadth, rather than the magnitude. Agriculture occupies virtually the entire space of the ranking between rice and sugar.
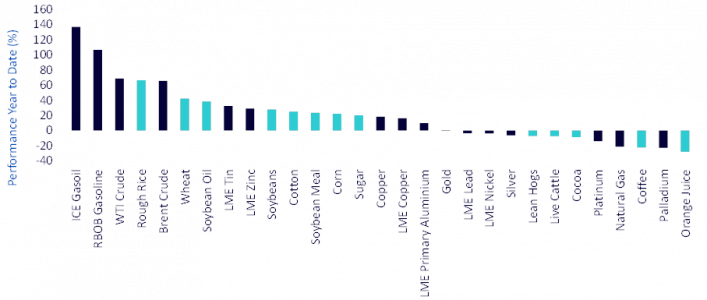
Cumulative Performance Year-to-Date Across Commodity Groups. Source: Bloomberg Finance L.P. and WisdomTree, as of September 21, 2026.

What has driven crops throughout the year has been almost exclusively geopolitical and input factors, rather than weather factors. Wheat is the clearest example: the World Agricultural Supply and Demand Estimates (WASDE) report for September was clearly bearish, as world production for the 2026/27 campaign was revised upward by 3.1 million tons to 822.4 million due to increased harvests in Australia and Canada, and ending stocks were increased by 3 million tons to 276.3 million. However, wheat prices have risen 42% year-to-date, as continued Russian and Ukrainian attacks against Black Sea port infrastructure have disrupted the physical route for nearly a quarter of world wheat exports. Net speculative positioning in wheat increased 130% last month, reflecting an improvement in confidence regarding this grain. For this commodity, the structural outlook could depend on whether the current risk premium proves persistent, rather than sporadic. Black Sea infrastructure has now become a recurrent target, rather than representing a one-off disruption, and Australian wheat is in the highest exposure band to El Niño for the 2026/27 harvest.

On the other hand, corn markets are highlighting a genuine supply contraction. U.S. production for 2026/27 was cut by 5.4 million tons to 401.3 million due to hot conditions and uneven rainfall. Global production was reduced by 7.9 million tons to 1,291 million, and global ending stocks fell by 2.6 million tons to 272.1 million. Net positioning increased 92%. In the case of corn, the argument that has been made for years is the constraint in inputs. Corn is the most nitrogen-intensive crop, and fertilizer prices are projected to remain above pre-conflict levels until 2028. Where prolonged under-application of phosphate and potassium is already observed, doses have decreased between 10% and 15% in recent years. Consequences on yield manifest with a three-year lag. This is a slow, cumulative drag that affects the yield trend, rather than a one-off single-season disruption, and is the mechanism by which this conflict extends beyond itself.

Meanwhile, the soybean sector has been driven more by demand than supply. The United States Department of Agriculture (USDA) has raised U.S. production to 123.4 million tons, but China has already purchased nearly 13 million tons this season, representing more than half of its annual commitment of 25 million tons, valid until the year 2028, in addition to a broader commitment to purchase $17 billion worth of agricultural products. China’s purchase commitment extends until 2028 and could provide some demand support that depends less directly on weather conditions. The reason for short-term caution is stocks: soybean and soybean oil reserves stand 7.9% and 8.5% above their five-year seasonal averages. Soybean oil features an additional and underappreciated support factor in the energy context: with crude oil above $100, biofuel demand could strengthen the vegetable oil sector independently of oil production.

Soft Commodities: The Sector Where the Meteorological Signal Is Least Reflected in Prices

The cumulative year-to-date performance table makes it clear. Sugar is up 20%, cotton up 25%, but cocoa is down 9%, coffee down 22%, and orange juice down 28%. The soft agricultural products sector, which historically has shown the greatest sensitivity to El Niño, has been the weakest link in the agricultural sector this year.

The exception is sugar and the clearest expression of the double impact. In early September, raw sugar was trading at 18.44 cents per pound, near the 16-month high located at 18.77 cents, as supply reduction reinforced expectations of a deficit in the 2026/27 campaign. Production in center-south Brazil fell 7.9% during the first half of August, and high energy prices continue to encourage mills to prioritize ethanol over sugar. India has authorized the duty-free import of one million tons of raw material, while drastically reducing ethanol diversion, a combination of measures suggesting domestic stocks are tighter than official figures indicate. Monsoon rainfall has been significantly below normal in Maharashtra, Karnataka, and Marathwada, regions representing close to one-third of Indian production. Sugar is affected by both meteorological conditions and energy price pass-through, and holds the thinnest inventory cushion among major soft agricultural products.

Cocoa is the crop generating the most controversy. Prices have recovered strongly since the low recorded in the second quarter, with New York futures standing around $6,250 per ton, and rainfall in West Africa during the August mini-drought was well below normal levels for this time of year, representing a real risk to pod survival and main crop development if rain does not fall. In contrast, the stock situation is fundamentally different from that of 2023/24. ICE-certified stocks have recovered to near their two-year high, while European cocoa grindings in the first quarter fell 4.6% year-on-year to reach their lowest level in 17 years. The cocoa sector faces this El Niño episode with reserves it lacked two years ago, and with demand clearly damped by the previous price crisis. The bullish thesis is based on weather conditions overcoming those reserves; it is not the same strategy as in 2023.

Regarding Arabica coffee, it faces improving supply: the Brazilian harvest is well advanced and revised export registry data indicate significantly higher flows than previously reported. Certified stocks remain near multi-year lows and physical availability is tight, but the supply trend is positive. The Robusta variety is the most interesting investment. It has been trading near multi-month lows, around $3,296 per ton, precisely as drought spreads across Indonesia and Vietnam during a critical flowering period. Since coffee is a perennial plant, damage suffered during flowering affects the 2027/28 crop, not the current one. Robusta coffee prices stand near their recent lows, even though major producing regions lie in the highest exposure band to the El Niño phenomenon. This creates a divergence between current prices and potential meteorological risks threatening supply.

For its part, cotton is up 25% year-to-date and is the commodity most dependent on demand. Recent price evolution has been downward due to improving U.S. crop conditions, declining export sales, and a strengthening dollar. The curve is in contango, somewhat steepened compared to wheat or corn, which contrasts with cotton stocks being the tightest of the group seasonally. That divergence highlights that the market is placing more weight on current crop conditions than on previous harvest scarcity, and that should a weather disruption occur in 2027, there would be very little margin for error. However, the long-term evolution of cotton is more closely tied to global textile demand and the dollar than to the Pacific region.

Conclusion

Two disruptions impact the same production window from different directions. The Gulf conflict increases cost and limits availability of inputs used prior to the 2026/27 campaign, doing so over a multi-year horizon, as damage affects production capacity rather than trade routes. El Niño increases the likelihood that the yields those inputs aim to protect fall below trend, with a lag in market transmission between six and twelve months relative to the oceanic peak, meaning its effects will be felt mainly in 2027.

The intensity of El Niño and its regional meteorological effects could differ from current forecasts, while an easing of geopolitical tensions could reduce pressure on energy and fertilizer markets. Better-than-expected harvests, inventory replenishment, lower demand, or changes in government policy could also offset pressures arising from meteorological conditions and input costs, resulting in commodity price performance different from that analyzed above.


What Are Semi-Liquid Funds?

  |   By  |  0 Comentarios

Pixabay CC0 Public Domain

For years, investing in private markets implied accepting a demanding commitment: locking up capital for eight, ten, or more years, with no real possibility of early exit. Semi-liquid funds emerged to soften that restriction and bring these asset classes closer to a broader investor audience.

It is a middle ground between two worlds. A semi-liquid fund is a vehicle that invests in non-publicly traded assets, such as unlisted companies, private loans, infrastructure, or real estate, but offers the investor a certain capacity to enter and exit on a periodic basis. It is thus situated between traditional funds with daily liquidity and classic closed-end private equity funds.

The key difference lies in frequency. While a conventional equity fund allows participations to be redeemed on any business day, a semi-liquid fund typically opens liquidity windows on a monthly, quarterly, or even semi-annual basis.

How Liquidity Is Managed

The underlying assets cannot be sold overnight without sacrificing value. For this reason, these funds incorporate protection mechanisms for the benefit of all unitholders. The most common are:

  • Advance notice: Investors must communicate their intention to exit weeks or months in advance.
  • Redemption caps: Many funds set a limit per period, for example, a percentage of total assets. If requests exceed this limit, they are met on a proportional basis.
  • Initial lock-up periods: A minimum holding period is common before requesting an exit.
  • Liquidity reserves: Part of the portfolio is kept in more liquid assets to meet ordinary redemptions.

These mechanisms are not a flaw, but part of the design. They acknowledge that the illiquidity of the asset is inherent to the strategy.

What the Investor Looks For

The main appeal is the illiquidity premium: the additional return that, in theory, is obtained by holding assets that cannot be sold quickly. Added to this are diversification—since private markets have dynamics different from public ones—and access to opportunities not available on the stock exchange.

Furthermore, the format lowers barriers. Many semi-liquid vehicles allow lower minimum investments than traditional closed-end funds and avoid staggered capital calls, where investors must contribute funds as the manager requests them.

Risks and Points of Attention

Liquidity is “semi,” not total. In stress scenarios, when many unitholders want to exit at the same time, limits can be activated and delay payment. It is crucial, therefore, not to consider these investments as capital for immediate use.

Attention should also be paid to valuation. As these are unlisted assets, their price is calculated through models and periodic appraisals, rather than daily market quotes, which can artificially smooth apparent volatility. And, as with any alternative strategy, fees tend to be higher than in traditional management.

A Tool, Not a Universal Solution

Semi-liquid funds expand options for those seeking to diversify beyond equities and fixed income. Their usefulness depends on the investor’s time horizon, liquidity needs, and understanding of the exit terms. Reading the prospectus in detail, understanding the redemption rules, and allocating only a prudent portion of the portfolio are basic practices before investing.

U.S. Inflation in September and Implications for the Fed

  |   By  |  0 Comentarios

Pixabay CC0 Public Domain

Inflation concerns continue to be the heaviest factor explaining short-term equity movements. The consensus among economists anticipated a strong U.S. inflation reading for September, which ultimately surprised on the downside: headline CPI reached +0.6%, in line with the year-over-year rate moving from 3.4% to 3.7%, while core CPI came in at +0.3% versus the +0.2% expected, shifting from 2.4% to 2.6% year-over-year. Its impact was amplified by the proximity of the Federal Reserve meeting scheduled for the 28th.

However, we believe the release was not strong enough to justify another rate hike in October. Beyond the impact of rising energy costs and the effect of AI investments on the prices of PCs, software, and mobile phones, the only aspect to monitor is the uptick in Owners’ Equivalent Rent (OER), which rose compared to the previous month.

The market’s immediate reaction to the data was to push expectations of a 25-basis-point rate hike in federal funds higher: probabilities spiked above 70%, only to quickly retreat to 12.7%, the lowest level since June. The September retail sales data (which deteriorated relative to August), the moderation in import prices shown in the Philadelphia Fed survey, and comments from Mary Daly (San Francisco Fed) and Michelle Bowman—who do not foresee a rate hike this month—exerted downward pressure on that probability, aiding the Treasury bond market. Regarding the U.S. Treasury bond, we do not believe that developments in the neocloud sector, discussed in the next section, were the main driver behind the yield compression. Investment in AI will continue to contribute positively to GDP in the coming months.

AI: Neocloud Strain and Ongoing Adoption

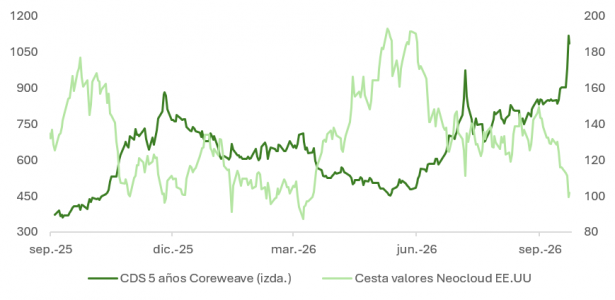
Inflation and its initial effect on the Treasury yield (which exceeded 5.32% on Wednesday before stabilizing near 5.08% on Friday) was also the catalyst for the sharp drop in share prices among neocloud companies. CoreWeave alarmed investors at the worst possible time by communicating that it would like to achieve an investment-grade credit rating to finance its growth on an “unlimited” basis. Its debt fell below 80 (against a par value of 100), having traded at par just a few months ago, while its CDS priced in a more than 50% probability of default over the next five years.

We consider this an isolated case affecting a subsegment of technology companies with higher financial leverage and greater sensitivity to rate hikes, rather than a red flag for the broader set of companies linked to the AI theme.

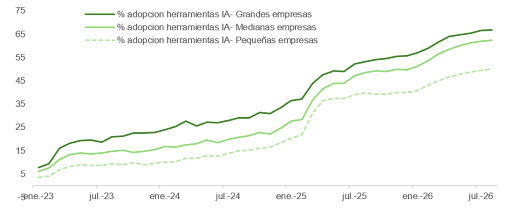
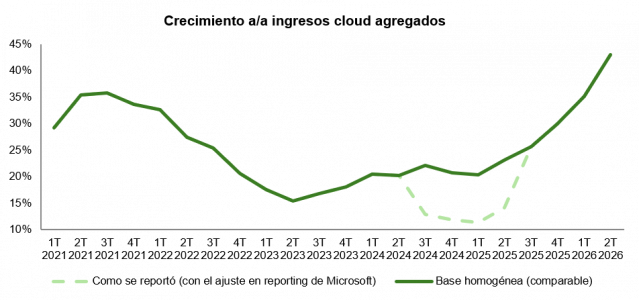
For now, the adoption of paid AI services among both large and small enterprises continues to advance, rising from 8% in large firms and less than 4% in small ones at the start of 2023 to 67% of large, 62% of mid-sized, and 50% of small businesses today—all within just three and a half years. Moreover, investments are being monetized: aggregate cloud revenues among major compute providers grew 43% year-over-year in the second quarter, based on nearly $370 billion over the last twelve months.

Geopolitics and the “Incompetence Premium” in U.S. Debt

In the short term, the evolution of inflation readings will be determined primarily by geopolitical factors. In this regard, uncertainty has heightened recently: Iran, through its Revolutionary Guard, has intensified threats against vessels that might “illegally” attempt to trade or load oil in the strait. Similarly, the Wall Street Journal reported comments from Iranian authorities regarding the deployment of troops to carry out retaliatory actions against U.S. allies in the Gulf.

As we have been explaining, one of the Iranians’ objectives is to keep the price of crude oil near $100 per barrel to minimize Trump’s chances of retaining control of the Senate as much as possible. However, the escalation in hostilities places Iran in a difficult situation to manage: overreaching in its pressure could hand Trump the justification he needs to strike with greater force once control of both houses is lost on November 3.

A poorly explained war, an imprecise central bank, and Treasury buybacks too small to move the needle have exasperated fixed-income buyers. Some strategists are already referring to an “incompetence premium” impacting the pricing of U.S. sovereign debt.

Woodford, Warsh, and the Abandonment of Forward Guidance

This is why the coincidence surrounding Kevin Warsh’s abandonment of forward guidance—which likely affected the structure of the yield curve—and the Nobel Prize in Economics awarded to Michael Woodford, arguably the academic who put the most effort into establishing a theoretical foundation for that concept, remains curious. The award arrived last Monday, October 12, four months after Warsh dropped the concept in the FOMC statement on June 17. That said, the contradiction is smaller than it appears at first glance.

In Interest and Prices (2003), Woodford argued that monetary policy operates primarily through expectations of the future rate trajectory rather than the rate applied today. At Jackson Hole (2012), he extended that concept to zero-lower-bound (ZIRP) environments. His recommendation was to communicate guidance state-contingent on the economy rather than tied to a calendar date. The Fed implemented this in December 2012 by incorporating unemployment and inflation thresholds into the FOMC statement.

His subsequent work with García-Schmidt (2019) on economic agents planning over finite horizons significantly tempers the impact of long-term projections. Thus, within his own body of work, we find reasons to believe that guidance was less potent than the models suggested.

In reality, the disagreement with Warsh lies in substance, not form. For Woodford, what must be communicated is the central bank’s reaction function to incoming data, not the path of interest rates. Warsh states that guidance has “outlasted its usefulness” and offers instead a “framework” or “roadmap,” provided it is not termed forward guidance. This closely aligns with abandoning the rate trajectory while retaining the reaction function—which is precisely what Wall Street requested.

Furthermore, an important nuance exists: Woodford advocated guidance as a tool specifically when rates are at zero. With federal funds at 3.75–4%, its marginal utility is significantly lower. Therefore, in my view, extrapolating what occurred post-COVID (in 2021, the issue lay in committing to a rate path in an unprecedented environment amid runaway inflation) with Powell’s “transitory inflation” commentary and the resulting loss of credibility would be a mistake.

What occurred then does not prove that communicating the Fed’s reaction function to the market is useless. The risk lies in leaving the market to guess it, which inherently increases uncertainty, noise, and volatility in the fixed-income market.

In summary, the Fed’s reaction function is the rule, explicit or implicit, that translates the state of the economy into a rate decision. Communicating it means telling the market how the Fed decides, without promising what it will do.

Communicating the reaction function establishes the rule: the market continues to react to data, but in the direction and magnitude intended by the Fed—exactly what Woodford advocated. The question with Warsh is whether, in removing guidance, he will also cease to communicate the rule.

Historic Record in Assets Under Management: BlackRock Crosses the $15.5 Trillion Threshold

  |   By  |  0 Comentarios

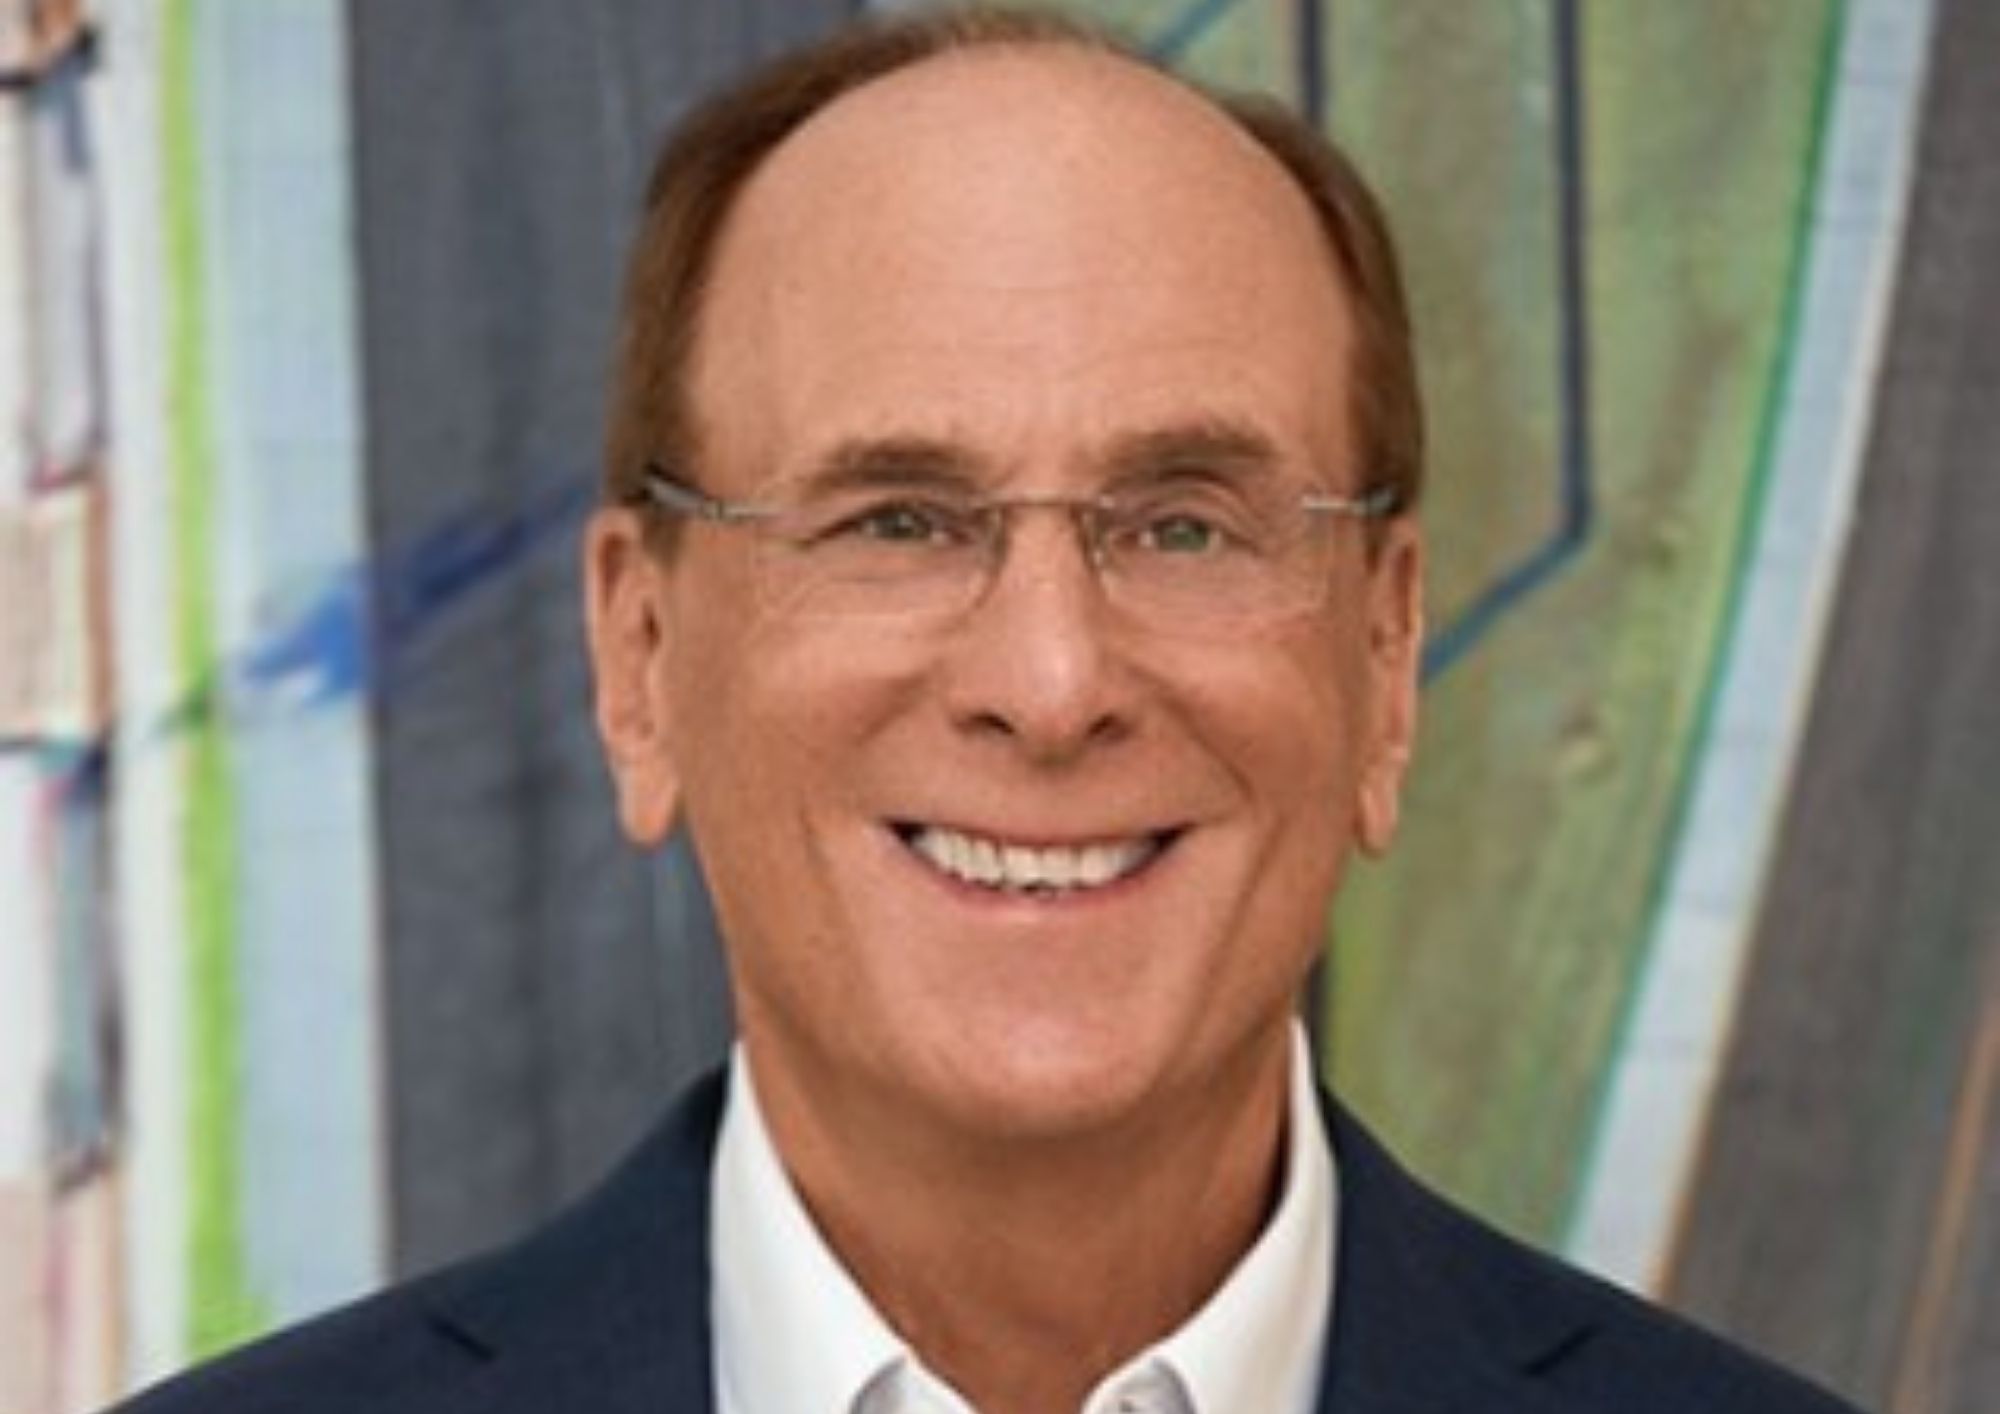
Photo courtesyLarry Fink, CEO and Chairman of BlackRock.

In its third-quarter results presentation, BlackRock announced that it has crossed the $15.5 trillion threshold in assets under management (AUM), driven by $869 billion in net inflows over the last twelve months, representing organic growth in base fees of 10%. “These results demonstrate the value of our integrated platform, as clients increasingly choose us as a partner in investment, financing, and technology. That client trust is translating into greater earnings power, with shareholders benefiting from a more than 35% year-over-year increase in adjusted earnings per share, an adjusted operating margin of 47.8%, and annualized organic base fee growth of 11% in the third quarter,” highlighted Larry Fink, CEO and Chairman of BlackRock.

This momentum is reflected in the $205 billion in net inflows recorded during the third quarter and an 11% annualized organic base fee growth, reflecting broad-based strength across iShares ETFs, systematic active equities, private markets, and cash. In this regard, Fink added: “Clients entrusted us with $205 billion in net inflows this quarter, and $869 billion over the past year. Our results reflect BlackRock’s scale, with 12% growth in technology ACV (Annual Contract Value) and net inflows across all asset classes, client types, regions, and in both active and index management.”

Solid investment performance drove $66 billion in active net inflows led by fixed income and systematic franchises, while iShares generated $135 billion in net inflows. “BlackRock brings together issuer relationships built over decades, financing expertise, investment performance, and the technology and data that connect everything. That combination is differentiating us in every region,” commented the CEO, highlighting the securing of mandates at the forefront of capital markets, raising $68 billion in private markets over the past year, and the first deployment of its AI Infrastructure Partnership. “We are entering our seasonally strongest fourth quarter with accelerating momentum and a broad pipeline. Demand for capital is growing across the global economy, and BlackRock is increasingly at the center of how that capital is deployed and managed,” Fink concluded.

Business Lines

On a financial level, investment advisory, administration fees, and securities lending revenue increased by $990 million compared to the third quarter of 2025, driven by organic base fee growth and the impact of market beta on average AUM. Compared to the second quarter of 2026, the increase was $310 million, also supported by the effect of one additional day in the quarter. Within this category, securities lending revenue reached $253 million (compared to $203 million in the third quarter of 2025 and $239 million in the second quarter of 2026), reflecting higher spreads and higher average balances of securities on loan.

On the other hand, performance fees grew by $114 million compared to the third quarter of 2025, primarily due to higher revenues from liquid alternative products related to a single hedge fund, partially offset by lower revenues in private markets. Compared to the second quarter of 2026, these fees increased by $325 million, driven by liquid alternative and private market products.

The firm’s technology business continued its expansion with 14% growth in technology services and subscription revenue year-over-year. In figures, this represented an increase of $73 million compared to the third quarter of 2025 and $22 million compared to the second quarter of 2026, reflecting sustained demand for Aladdin and multi-product solutions, with ACV increasing 12% year-over-year.

Finally, distribution fees experienced an increase of $59 million compared to the third quarter of 2025, an increase directly driven by the company’s higher average assets under management (AUM).

Franklin Templeton Launches First Active UCITS ETF from Putnam Investments

  |   By  |  0 Comentarios

Canva

Franklin Templeton has today announced the launch of the Franklin Putnam Focused US Research UCITS ETF, which it explains is the first actively managed ETF from Putnam Investments in Europe. The firm details that the fund will list on Deutsche Börse Xetra, the London Stock Exchange, and Borsa Italiana on October 15, 2026. In addition, the fund is registered for distribution in Austria, Denmark, Finland, France, Germany, Ireland (country of domicile), Italy, Luxembourg, the Netherlands, Spain, Sweden, and the United Kingdom.

The firm notes that the launch “builds on the strong momentum of Putnam’s investment capabilities in Europe and follows the recent launch of the FTGF Putnam Global Research Fund.” Both new products are based on Putnam’s distinctive investment approach, which centers on stock selection and combines deep fundamental research, collaboration among sector specialists, and disciplined portfolio construction. The new ETF provides access to a more concentrated portfolio consisting of the U.S. equity investment ideas in which the investment team has the highest conviction.

“The launch of Putnam’s first active ETF in Europe represents a new step in expanding our investment offering in the region. European investors are increasingly seeking differentiated alternatives for accessing U.S. equities, and we see significant opportunities to meet this demand by combining Putnam’s investment expertise and track record with the flexibility and accessibility of the ETF format,” commented Javier Villegas, Head of Iberia and Latin America at Franklin Templeton.

In his view, bringing Putnam’s established US Research strategy in an ETF format also reflects their commitment to bringing Franklin Templeton’s full range of global investment capabilities closer to European clients, “offering them a wider variety of strategies and investment vehicles tailored to their needs.”

About the Fund

As explained, the Franklin Putnam Focused US Research UCITS ETF is a high-conviction U.S. equity strategy focused on large-cap companies with a core approach, delivered in an actively managed ETF format. It will invest in between 30 and 45 securities representing the investment ideas in which the team has the highest conviction within the broader US Research strategy, which has outperformed the S&P 500 index in 7 of the last 8 years across both growth-driven and value-oriented markets.

The managers collaborate with sector specialists to develop high-conviction ideas through rigorous fundamental research, which are subsequently integrated into a concentrated equity portfolio. Matt LaPlant, CFA, is responsible for implementing the integrated risk management component in order to mitigate any bias toward specific investment factors or styles. The ETF will be managed by Kate Lakin, Matt LaPlant, CFA, Jackie Cavanaugh, Robert Gray, and Will Rives, CFA, who bring an average of 22 years of investment industry experience.

“The ETF leverages the deep sector expertise of our research team, with stock selection as the core of the investment process. By focusing on our strongest ideas, we aim to generate superior returns while utilizing disciplined risk management to limit exposure to specific factors or investment styles,” explained Kate Lakin, portfolio manager at Putnam Investments.

Vanguard Anticipates High-Growth Macroeconomic Environment Similar to the 1990s Driven by AI Development

  |   By  |  0 Comentarios

Canva

Not one, nor two, but three: three have been the shocks that markets have been experiencing this year. A shock produced by AI, the energy price shock on account of the conflict between Iran and the United States, and, more recently, the sharp correction seen in sovereign debt. Josefina Rodríguez, an economist with Vanguard’s Investment Strategy Group team, recently shared at a media breakfast in Madrid how her firm’s macro vision is articulated around these three shocks. A clue: the central scenario her team’s experts are working with is more optimistic than the consensus, particularly regarding AI.

Artificial Intelligence Shock

Consensus estimates capex spending by major hyperscalers at around 1.3 trillion euros for 2026, a figure that rises to 1.7 trillion looking toward 2027… six times higher than the numbers these companies were handling a year before the pandemic, in 2019. Rodríguez noted that market expectations are high, but added that if these companies actually manage to capitalize on their investments, it will have a direct impact on the real economy and, in turn, drive private investment, particularly in the U.S.

The expert added that Vanguard’s view is that “the investment cycle will be higher and longer than the historical average, and with greater demand.” According to the firm’s calculations, private investment in the U.S. could reach 10%. Considering that investment accounts for 20% of total U.S. GDP, she anticipates that the country will grow next year at a rate of 3%, compared to the 2% anticipated by the consensus.

This optimistic view on AI will obviously be reflected in equities. The economist recalled that the current environment features high valuations backed by solid earnings, “which offer breathing room to face today’s high rates,” and indicated that the consensus forecast for next year is for corporate earnings to grow once again at a double-digit rate.

However, the expert clarified that the trajectory of the AI investment cycle will not be linear. Vanguard’s baseline scenario foresees continued gains at a rate similar to the current one over the next 12 to 18 months, followed by an inevitable market correction triggered by one of these catalysts, or a combination of several:

  • Lack of monetization
  • Commoditization of competition, with high levels of uncertainty driven by the launch of new models
  • Physical bottlenecks
  • Potentially stricter regulation

Energy Shock

The expert described the recent surge in gas prices and Brent crude climbing back above $100 as “a second wave,” referring to the initial peak recorded following the outbreak of hostilities between the United States and Iran. The difference is that this time it has been accompanied by a decoupling between refining margins and crude prices, which is also impacting final consumer prices. Furthermore, she highlighted that the spike in natural gas prices has left Europe in a vulnerable position as it entered this autumn with inventories at very low levels.

How is this energy price escalation impacting inflation? Rodríguez asked to frame the data within the context that major central banks have failed to maintain inflation at their 2% target on a sustained basis over the past five years. For her, the issue is that now the base effect of rising prices is also being channeled via goods-related inflation (transportation, for example), which carries a larger weight in the CPI calculation. Thus, Vanguard forecasts that both the ECB and the Bank of England (BoE) will raise interest rates twice each over the next six months.

The expert also detailed another important consideration when approaching inflation under these macro conditions: the possibility that the neutral interest rate could be higher than in the past. Two main factors would press against financial conditions and justify a higher neutral rate: elevated government deficits and an increase in capital demand from both governments and corporations.

Specifically, the thesis Vanguard is working with is that this neutral rate should sit above 4% in the U.S., compared to the Federal Reserve’s estimate that it should lie between 3% and 3.5%. “This could explain why the Fed has not been able to get inflation back down to its target,” commented Rodríguez.

Bond Shock

The third component of the equation is the recent correction in bonds, with the yield curve under particular pressure at the long end. Here, the economist detailed that Vanguard is working with three baseline scenarios, with its central scenario being the most optimistic of the three: a macro environment similar to that experienced in the 1990s during the expansion of telecommunications, with interest rates near 4% and inflation at 2%. This environment would be marked by AI’s ability to meaningfully boost productivity, driving growth and reducing government deficits. Additionally, the firm considers that part of AI’s transformative power could also impact longevity and healthy habits, translating into a reduction in healthcare expenditures.

The second scenario to which the firm assigns a higher probability is similar to the 1980s: AI is not transformative enough to drive productivity demand with a positive impact, leaving interest rates at 5% and inflation between 2% and 3%. It would also be a scenario marked by higher fiscal pressures.

The final scenario, assigned the lowest probability, would resemble the 1970s: a period of fiscal dominance where the Fed’s margin for maneuver would be narrow, as it could not raise interest rates sufficiently due to fiscal risks. In this scenario, rates would sit at 4% with inflation above 3%, pushing nominal rates above 7%.

Which Assets Could Perform Best?

The final part of the presentation revolved around Vanguard’s estimates regarding performance across different asset classes over the coming decade. The firm expressed a preference for fixed income assets, calculating based on its central scenario that annual returns for both equities and fixed income will hover around 5% per year over the next ten years, making fixed income the alternative offering the best risk-adjusted return.

How Do the World’s Largest Institutional Investors Invest in Crypto?

  |   By  |  0 Comentarios

Canva

Large institutional investors have demonstrated strong resilience in their adoption of digital assets, as Bitwise asserts in its latest report, “Inaugural Report on How the World’s Largest Institutions Are Investing in Crypto Today,” noting that none reduced their exposure during the recent 50% market decline, and several even took advantage of the dip to buy more.

The report reveals that all of these investors hold Bitcoin as their core and longest-held position, increasingly treating it as an asset paired with gold within allocations that mostly range between 1% and 2% of their portfolios. Likewise, although they maintain secondary positions in Ethereum and Solana with shorter horizons and explicit exit conditions, the report emphasizes that price is not a reason to sell for any of them; they would only liquidate their investments in the event of a failure in their initial thesis, adverse regulatory changes, or an industry credibility crisis.

These institutions rarely disclose their crypto asset positions, whether for competitive or reputational reasons. This study aims to break that silence by asking managers directly which assets they hold, in what amounts, for what reasons, and under what circumstances they would sell.

The findings suggest that adoption is occurring faster and more permanently than the general public perceives, supporting Bitwise’s forecast that a majority of institutional investors will hold crypto assets in their portfolios within five years.

“Institutional investors are adopting crypto assets as a major component of their portfolios. Adoption is happening faster and more consistently than the general public may realize,” notes Matt Hougan, Chief Investment Officer at Bitwise. He adds: “Markets fell by roughly 50% between Q4 2025 and Q2 2026, yet not a single institution we interviewed reduced its allocation during the sell-off, while several bought more. When asked what would trigger an exit, none mentioned price. That directly contradicts the common assumption that institutions are weak-handed investors during pullbacks.”

According to Ryan Rasmussen, Head of Research at Bitwise, what stands out from these conversations is the consistency reached across industry criteria. “Institutions with different mandates, governance structures, and constraints have arrived at a strikingly similar framework for approaching crypto assets in their portfolios,” he states. “Bitcoin serves as the anchor, often alongside gold, while Ethereum and Solana are earning their place. This pattern holds true across the world’s largest institutions, from sovereign wealth funds to university endowments, pensions, and foundations,” he concludes.

Tax Structure: The Factor Gaining Weight Among Global Citizens Evaluating Relocation

  |   By  |  0 Comentarios

Canva

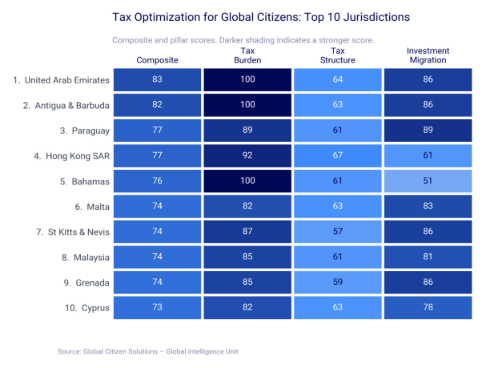
Global Citizen Solutions (GCS), the international firm specializing in residency and citizenship planning consultancy, has published a new report prepared by its research department, the Global Intelligence Unit (GIU), titled Tax Optimization for Global Citizens, a comparative study of tax positions across 48 jurisdictions for internationally mobile individuals. The report evaluates each jurisdiction based on 11 indicators grouped into three pillars (Tax Burden, Tax Structure, and Investment Migration, with weightings of 42.5%, 42.5%, and 15% respectively), under the premise that how a tax system treats foreign income and departing residents matters just as much as the nominal rate it charges.

The United Arab Emirates leads the overall ranking by combining a 0% personal income tax rate with a 5% consumption tax and no charges at the time of departure. Antigua and Barbuda, Paraguay, Hong Kong, and the Bahamas complete the top five. Malta and Cyprus are the only two European jurisdictions to enter the top ten, doing so through preferential regimes rather than low nominal rates.

Tax Optimization Chart for Global Citizens. Source: Global Intelligence Unit in its report “Tax Optimization for Global Citizens”

Tax Structure Weighs Heavier Than the Nominal Rate

The central finding of the report is that a jurisdiction’s tax rate and the structure of its tax system are largely independent of one another. Uruguay charges 36%, a rate closer to Western Europe than the Caribbean, yet records the highest Tax Structure score in the entire sample, placing twelfth overall exclusively due to that structure. Hungary, by contrast, charges 15% but ranks 31st because it taxes its tax residents on worldwide income and offers no substantial relief to newcomers.

Two mechanisms explain a high score in Tax Structure: a tax base that never reaches foreign income, as in Uruguay, Panama, and Hong Kong, or that only reaches it upon remittance, as in Malta and Mauritius; and a preferential regime superimposed on a system that otherwise taxes worldwide income, as in Cyprus, Portugal, and Italy.

“The countries that break the dilemma between taxes and quality of life—among them Malta, Cyprus, Uruguay, Costa Rica, Mauritius, Switzerland, and Portugal—do not achieve this by charging zero taxes. They manage it by taxing on a territorial or remittance basis, or through a well-designed preferential regime, leaving room to fund the public services that quality of life depends on. That is the true decision facing anyone who relocates: it is not simply about the lowest tax rate, but how foreign income is treated, whether through automatic exemption, partial relief, or more targeted exceptions, and how much certainty that structure actually offers,” comments Artur Saraiva, Founder and COO of Global Citizen Solutions.

Living Well, Departing Well

The report’s two structural findings point in opposite directions. Jurisdictions charging fewer taxes tend to rank lower in quality of life, meaning that what a resident saves in taxes is weighed against what they sacrifice in daily life. Thirty-one of the 48 jurisdictions in the study impose no exit tax, including all jurisdictions in Latin America and the Caribbean, so a lower cost of living rarely comes accompanied by a lower cost of departure, and a higher cost of living does not guarantee an easier exit either.

Seven jurisdictions break this quality-of-life pattern by combining a tax position in the top half of the table with a spot among the world’s top 50 in quality of life: Malta, Cyprus, Uruguay, Costa Rica, Mauritius, Switzerland, and Portugal. None achieves this by charging zero income tax. Each instead utilizes a territorial, remittance, or preferential regime structure that leaves room to fund the public services upon which quality of life relies. Regarding departure, eleven of the seventeen jurisdictions that do charge upon departure—including Australia, Canada, Denmark, Germany, Norway, Spain, and Switzerland—apply a broad charge with the possibility of deferral, while five, including Portugal, the United Kingdom, and Japan, apply a more limited version. The United States concentrates the highest tax burden in the entire sample, both by rate and by structure, while also imposing the most demanding departure conditions of all analyzed jurisdictions: deferral is only available against collateral acceptable to the U.S. Treasury, only if the expatriate permanently waives treaty protections, and only with interest that accrues until the tax is paid.

Death, Taxes, and Exceptions

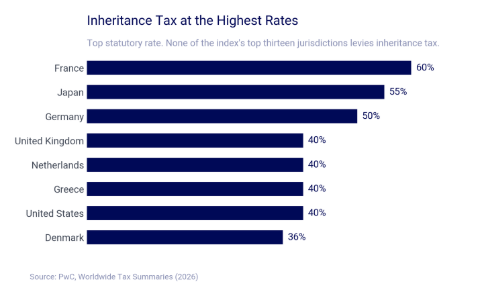
Inheritance tax separates higher-burden systems from the index leaders more clearly than any other metric. France charges up to 60%, Japan 55%, and Germany 50%, whereas none of the thirteen leading jurisdictions in the index levy an inheritance tax. The report also highlights the United States as an outlier: since it taxes its citizens on their worldwide income regardless of where they live, relocating alone does not end a U.S. citizen’s tax obligations.

Highest Percentage Inheritance Tax Chart. Source: Global Intelligence Unit in its report “Tax Optimization for Global Citizens”

Net Wealth Tax, a Rarity

Net wealth tax applies in only eight of the 48 jurisdictions in the sample, with rates ranging from 0.1% in Uruguay to 3.5% in Spain. None of the jurisdictions that do not levy personal income tax apply a wealth tax either, meaning the absence of an income tax and the absence of a wealth tax usually go hand in hand rather than offsetting each other.

The report concludes that no single jurisdiction fits every profile. Entrepreneurs approaching a liquidity event are guided by the treatment of capital gains and the cost of departure; retirees, by inheritance, healthcare, and consumption taxes; and remote professionals, almost exclusively, by the tax base applied to foreign-source income. The full report presents specific lists for each of these profiles across the 48 analyzed jurisdictions.

What Fees Are Associated with Active Management?

  |   By  |  0 Comentarios

Pixabay CC0 Public Domain

Choosing an actively managed fund involves paying for the work of a team that selects assets with the goal of outperforming its benchmark index. That service comes at a price, and understanding its components is key: costs directly reduce the return the investor receives, year after year.

Management fees are the most well-known charge. They are expressed as an annual percentage of the fund’s assets and compensate the manager and their research team. Investors do not pay them explicitly: they are deducted daily from the share value, so they are rarely perceived as an out-of-pocket expense. The amount varies depending on the asset class and strategy. Specialized equity or emerging market funds tend to sit at the higher end of the range, while fixed income funds are usually cheaper.

Performance fees. Some funds, especially alternative ones, also charge a fee tied to performance, subject to the product’s terms. Among the mechanisms that can protect the investor are the hurdle rate, which must be surpassed before charging, and the high-water mark, which prevents charging again for recovering previous losses within the established reference period. Not all funds incorporate both mechanisms. This fee aims to align the manager’s interests with those of the client, although it can also incentivize taking on more risk.

Subscription, Redemption, and Distribution Fees

Some management companies charge a percentage when entering or exiting the fund. It is a one-off charge, which many share classes eliminate, especially those aimed at institutional clients.

It is also worth distinguishing distribution costs. A portion of the management fee is often allocated to the bank, platform, or advisor marketing the fund through rebates or trailer fees. Transparency rules vary by jurisdiction, so it is worth asking how much of what is paid goes toward compensating distribution.

Transaction Costs and Other Expenses

Every time the manager buys or sells an asset, the fund absorbs brokerage fees, bid-ask spreads, and transaction taxes. Higher portfolio turnover generally means higher costs. In many markets, these expenses are reported separately from the expense ratio, so investors must look for them in the documentation. Added to these are custody, administration, audit, and legal advisory expenses.

How to Compare Them

The most widely used benchmark is the total expense ratio, known as the TER. The ongoing charges figure is also used, although both may include different concepts, especially regarding performance fees. They summarize much of the annual charges, but not all the costs of investing. It is advisable to check what each metric includes in the fund documentation.

To gauge its impact, a simple example: a $100,000 investment with a gross return of 6% annually over 20 years. Assuming constant returns and costs and reinvestment of earnings, excluding taxes, with an annual cost of 1.5%, the net return would be 4.5% and the final capital would be around $241,000. With a cost of 0.2%, the net would be 5.8% and the result close to $309,000. The difference, of about $67,000, illustrates how a percentage that seems small compounds over time.

This does not mean active management fails to justify its price. The relevant question is whether the manager’s added value, measured after fees and against its benchmark index and comparable funds, compensates for the additional cost. Knowing each component enables the investor to ask that question with sound judgment and make better-informed choices.

Besides Buffett, Who Are the Other “Legends” of the Investment World?

  |   By  |  0 Comentarios

The legendary Warren Buffett has stepped away from the day-to-day operations of Berkshire and, in a way, the markets have been left without a touchstone that accompanied them for years; however, the financial industry has many other figures who transformed the understanding of risk, value, markets, and wealth creation.

Now that Berkshire Hathaway has formally entered a new phase—Buffett was named Chairman Emeritus on September 18 and Greg Abel remains CEO—an inevitable question arises: who are the other figures who have built schools of investing capable of transcending their own results? The answer lies not in searching for another Buffett.

In fact, perhaps that is the primary lesson: the investment world does not have a single formula, it has different schools of thought: value investing, macro investing, credit, quantitative analysis, growth, corporate activism, and global stock selection.

Some of these figures managed funds for decades; others built institutions; some retired years ago, while others continue to actively participate in the markets. But all of them left behind something more than a profit-and-loss statement: a way of thinking that continues to be studied by professional investors. These are some of those other legends.

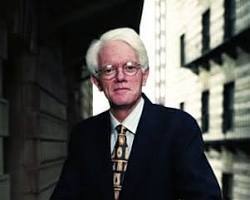
Peter Lynch: Finding Opportunities Where Others Are Not Looking

If Buffett turned value investing into an almost universal philosophy, Peter Lynch did something different: he enabled millions of everyday investors to understand that daily observation could also become an analytical tool. Lynch directed Fidelity’s Magellan Fund between 1977 and 1990. During those 13 years, the fund achieved an average annual return of 29.2%, compared to 15.8% for the S&P 500, according to Wharton. His philosophy was condensed into a phrase that became part of market vocabulary: “invest in what you know.”

However, reducing Lynch to that phrase would oversimplify his method. Behind the idea was a discipline of research: observing companies, understanding their businesses, identifying growth opportunities, and subsequently analyzing their financials. Lynch retired from Magellan in 1990 at just 46 years old. Since then, he has become one of the great advocates for equity investing. His legacy is perhaps particularly relevant in an era dominated by algorithms, artificial intelligence, and large quantitative models: before buying a stock, one must understand what the company does.

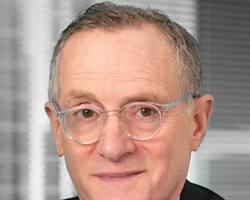
Howard Marks: The Investor Who Placed Risk Center Stage

There are investors known for their returns. Howard Marks belongs to a different category: he is also known for how he thinks and writes about risk. Marks co-founded Oaktree Capital Management in 1995, after developing years of expertise in high-yield bonds, distressed debt, and convertibles.

He currently continues as Co-Chairman of Oaktree, but his influence extends beyond asset management. His memos to investors became reference texts within the professional community, and books like The Most Important Thing popularized an idea that sounds simple, yet proves extraordinarily difficult to execute: investing is not solely about seeking returns, it is about understanding what risks are being assumed to achieve them. Oaktree’s own philosophy summarizes much of his legacy: an opportunistic, value-oriented approach with risk control, particularly developed in credit markets. Marks represents, in a sense, the other side of Buffett: while Buffett built much of his reputation around buying extraordinary businesses and holding them for a long time, Marks made moments of financial stress and misperceptions of risk a realm of opportunity.

Seth Klarman: Waiting Is Also an Investment Decision

Seth Klarman is another direct heir to the tradition of Benjamin Graham, but he expanded the concept of margin of safety into broader territories. He is the CEO and Portfolio Manager of The Baupost Group, a firm he founded in 1982 and whose investments he has supervised ever since. Baupost applies a value discipline with a tilt toward special situations, including public and private equities, distressed debt, bankruptcies, and real estate.

His book Margin of Safety, originally published in 1991, became one of the most sought-after texts by those who study value investing. Klarman’s teaching has a characteristic that is particularly uncomfortable for today’s markets: not investing can also be an investment decision. When prices do not offer a sufficient margin of safety, capital can remain in cash until an opportunity appears. In an industry accustomed to measuring success by the amount of assets deployed and manager activity, that patience is almost a provocation.

Stanley Druckenmiller: When Conviction Outweighs the Label

Druckenmiller belongs to an entirely different school. He did not build his reputation buying undervalued companies to hold them for decades. His domain was macro investing: interest rates, currencies, economic cycles, monetary policy, and major market moves.

At the helm of Duquesne Capital Management, he generated approximately 30% annualized returns between 1981 and 2010 and did not record a single losing year, according to Morgan Stanley. But perhaps the most interesting aspect of Druckenmiller is not the figure, but his mindset.

In a recent conversation with Morgan Stanley, he explained that he does not consider being a contrarian a virtue in itself. The market can be right many times; what matters, in his experience, is recognizing those moments when there is strong enough conviction to step away from the crowd.

After closing Duquesne Capital in 2010, he continued managing his wealth through his family office. Druckenmiller represents a lesson different from Buffett’s: not all great investments require decades to mature; some require correctly identifying a regime change and having the conviction to act.

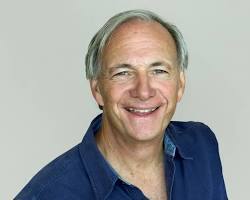
Ray Dalio: Turning a Philosophy into a System

Ray Dalio achieved something few investors accomplish: he transformed a personal philosophy into an institution. He founded Bridgewater Associates in 1975 out of a two-bedroom apartment in New York and turned it, over the decades, into one of the largest alternative investment firms in the world. Dalio stepped down as CEO in 2017, as CIO in 2020, and as Chairman in 2021; he currently focuses primarily on passing down the principles developed throughout his career. His most famous contribution to the investment world is the All Weather concept and the development of risk parity strategies, alongside an investment architecture based on diversification across stocks, bonds, currencies, and commodities.

Yet his major conceptual contribution perhaps lies elsewhere: the obsession with turning investment decisions into repeatable processes. Bridgewater developed systems that combine historical research, algorithms, backtesting, and human judgment. The idea is simple: if economic cycles repeat with specific characteristics, studying the past allows one to build rules to navigate future scenarios. Dalio thus turned manager experience into something akin to decision engineering.

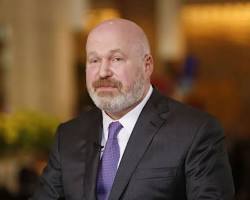
Cliff Asness: Where Wall Street Meets Academia

If Buffett represents business-based investing and Marks the reading of risk, Cliff Asness represents another revolution: quantitative investing based on statistical evidence. Asness founded AQR Capital Management alongside David Kabiller, Robert Krail, and John Liew in 1998. He had previously served as Director of Quantitative Research at Goldman Sachs. His career is deeply tied to academic research on factors such as value, momentum, quality, and other sources of return.

AQR was born precisely at that intersection of economics, behavioral finance, data, and technology. Asness has also defended an idea that is especially important in the era of artificial intelligence: a good backtest is not enough. In an interview published by the Journal of Portfolio Management, he explained that the challenge consists of finding strategies supported by both statistical evidence and a coherent economic rationale. Otherwise, the model may end up capturing simple historical noise. His legacy is, in essence, a question: what happens when a manager’s intuition can be converted into data, rules, and testable processes?

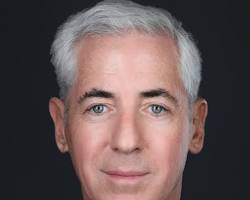
Bill Ackman: The Shareholder Who Does Not Sit Still

William Ackman belongs to another tradition: shareholder activism. He founded Pershing Square Capital Management in 2004 and built a strategy concentrated on a relatively small number of companies. Pershing Square notes that it typically holds between eight and 12 core positions, fundamentally in large North American public companies.

The philosophy differs from conventional diversification: select a few high-quality businesses, study them deeply, and, when necessary, use the equity stake to drive operational, financial, or corporate governance changes. Pershing Square’s track record is also part of the conversation. Its corporate documentation reports that from 2004 through December 2025, the Pershing Square, L.P. fund achieved a cumulative compound annual return that materially outperformed the S&P 500 over that period, net of fees.

Ackman represents an evolution of the investor’s role: not just allocating capital, but attempting to alter the path of the company in which one invests. It is a philosophy that can produce massive successes and also significant controversy, precisely because the manager ceases to be a passive shareholder and becomes an active participant in corporate strategy.

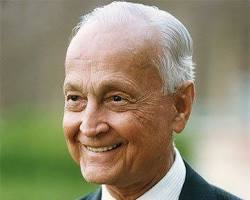
John Templeton: Buying When the World Wants to Sell

If one had to select one of the great pioneers of global investing, it would be difficult not to mention Sir John Templeton. Templeton began his Wall Street career in 1938 and created the Templeton Growth Fund in 1954, one of the first major global investment vehicles. His philosophy consisted of searching for opportunities where pessimism had driven prices to extreme levels.

His first major trade is almost a parable of value investing: when World War II began, he borrowed money to buy 100 shares in 104 companies trading at one dollar or less. Of those 104 companies, 34 were in bankruptcy; only four turned out to be complete losses. The result of that philosophy became legend. According to the John Templeton Foundation, a $10,000 investment in the Templeton Growth Fund at inception, with dividends reinvested, would have reached approximately $2 million by 1992, when Templeton sold the fund family to Franklin Group.

His legacy is especially interesting today, when investors tend to concentrate on specific countries, sectors, and companies. Templeton taught that the best opportunities are not always where enthusiasm lies, but where price reflects a pessimism that may be exaggerated.

Schools Outlast Their Masters

Taken together, this gallery explains something important about Buffett’s departure from leading Berkshire: There is no single intellectual successor. Lynch taught how to look at companies through everyday life. Marks put risk at the center of the conversation. Klarman took the margin of safety to its ultimate conclusions. Druckenmiller demonstrated the power of macro investing and conviction. Dalio turned diversification and risk management into a system. Asness shifted investing toward data and quantitative research. Ackman transformed the shareholder into an agent of corporate change. Templeton made global pessimism a source of opportunity.

These are different and even, in some cases, contradictory philosophies, but that is precisely why they remain relevant. In truth, everything indicates that the investment industry is not entering a post-Buffett era, but rather a stage where Buffett’s influence coexists with many other ways to understand how capital is created and protected. Perhaps that is the true legacy of investment legends: not leaving behind a formula to copy, but demonstrating that behind extraordinary returns, there is usually a distinct—and disciplined—way of thinking.

Buffett will continue to be part of that story from Berkshire, now as Chairman Emeritus and Director. But while his seat changes occupants, the various schools that helped build modern investing remain active. And the markets, as always, will continue to put each of them to the test.