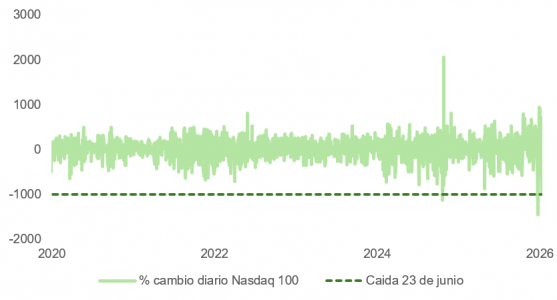
Hedge funds, which have maintained significant long positions in technology broadly—and in semiconductors and hardware in particular—are beginning to consider taking profits. On Tuesday, the Nasdaq posted one of the largest point declines in its history.
However, important technical factors also amplified the selloff in AI-related stocks. Assets invested in leveraged ETFs tied to technology or semiconductor indexes—such as TQQQ, SOXL, or MUU, the 2x leveraged ETF linked to Micron shares—have surged (+39% for the first, +261% for the second), with the category now approaching $190 billion in assets, an unthinkable figure just five years ago. The well-known 7709—the largest 2x leveraged ETF tracking SK Hynix, the memory chip manufacturer—has reached $16 billion in assets, while the Direxion Daily MU Bull 2X Shares ETF linked to Micron is approaching a market capitalization of $8 billion.
A 2x or 3x leveraged ETF must rebalance its exposure every day to maintain its leverage multiple. If the underlying index rises, the fund must buy additional exposure at the close; if it falls, it must sell. This daily rebalancing creates what is structurally a short gamma profile: buying into strength and selling into weakness. The more assets these products accumulate, the larger the mechanical trading flows generated by every market move.
This dynamic is amplified further because positioning is concentrated in only a handful of names. Memory and semiconductor stocks account for more than 10% of hedge funds’ long exposure, while roughly three-quarters of short gamma exposure is concentrated in semiconductors, the Nasdaq-100 (NDX) and related names. When the same hedging activity repeatedly impacts the same stocks, price movements become concentrated rather than dispersed.
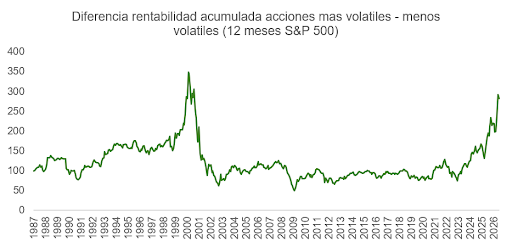
The situation becomes even more complex when considering that the volatility of the stocks that have contributed most to the S&P 500’s appreciation is approaching the levels seen at the peak of the dot-com bubble. Given that those returns are concentrated in just a handful of stocks and sectors, portfolio risk management becomes significantly more challenging. At the same time, the risk of gamma-driven market effects increases if retail investors begin exiting leveraged products en masse. The resulting volatility drag could trigger a wave of investor dissatisfaction with these leveraged ETFs.
This mathematical effect, which is particularly pronounced in leveraged and inverse ETFs that must rebalance their exposure to the underlying asset on a daily basis, results in a gradual loss of value caused by day-to-day price fluctuations—even when the underlying asset ultimately returns to its original level.
Consider a simple example: an index falls by 10% and then rises by 10%. An unleveraged fund would decline from $100 to $90 and then recover to $99 after the rebound. A 3x leveraged ETF, however, would recover only to $91 following the same movement in the underlying index.
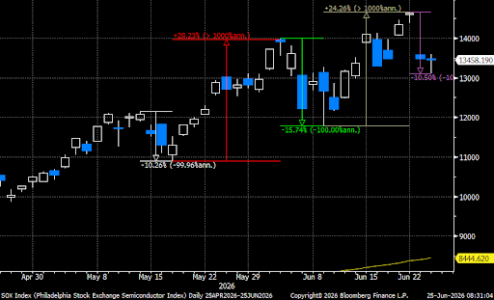
The recent volatility in semiconductor stocks—as reflected in the Philadelphia Semiconductor Index (SOX)—provides an ideal environment for this effect to materialize.
Micron’s earnings, released Wednesday evening, exceeded already ambitious expectations and could continue to support capital flows into leveraged products. However, this momentum is accompanied by increased market instability that should not be underestimated.
In addition, efforts to manage memory chip supply bottlenecks are beginning to spill over into consumer prices and inflation readings. Apple’s announcement of 15% to 25% price increases for Macs and iPads, beyond its implications for the company itself, suggests that the strategy of capitalizing on supply constraints may be reaching its limits.
Global Macro: PMIs Improve While Energy Prices Decline
The volatility in equity markets contrasts with the constructive economic data released this week. June flash PMI readings generally surprised to the upside, suggesting that the global economy continues to absorb the energy shock better than expected.
The U.S. composite PMI rose to 52.2 in June, its highest level since the onset of the conflict with Iran. In the eurozone, the composite PMI also exceeded expectations, coming in at 49.5 versus the 49.2 consensus forecast. Taken together, the data paint a constructive picture of the global economy as the second quarter draws to a close.
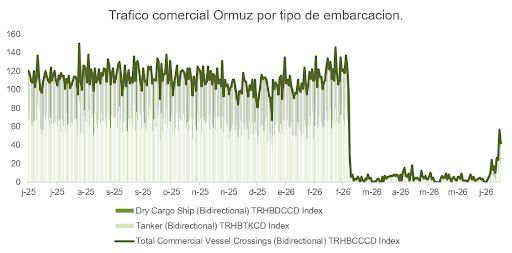
Markets also received another supportive tailwind in the form of lower energy prices. Brent crude fell to $73.80 per barrel, its lowest level in three months, reflecting the beginning of a normalization of maritime traffic through the Strait of Hormuz.
Dollar and the Fed: Enduring Dominance, but an Opportunity to Reduce Exposure
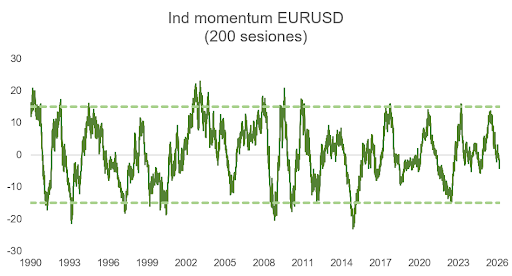
With the U.S. economy showing stronger momentum than Europe’s, the euro this week broke below its summer 2025 lows against the U.S. dollar.
The dollar’s dominance no longer appears to be under serious challenge. Neither the euro nor the renminbi represents a credible rival over the short to medium term. The euro continues to face unresolved questions in the absence of a genuine fiscal union—as illustrated by France’s budgetary difficulties in 2025. Meanwhile, the Chinese renminbi (CNY) would require a fully open capital account and much deeper, more liquid financial markets before becoming a meaningful alternative, a process that could take decades.
In reality, central banks have not been selling dollars; rather, they have been diversifying their reserves into other currencies. That diversification, concentrated in smaller currencies such as the Canadian and Australian dollars, has risen from 2% to 11% since 2000—a shift that remains far too small to undermine global demand for the U.S. dollar.
The global savings surplus generated by China, the eurozone, Japan and the Gulf countries continues to be structurally recycled into U.S. assets because only the United States offers financial markets with sufficient depth and liquidity to absorb those flows. Net foreign capital inflows into U.S. assets have returned to record highs, and that trend is likely to persist as long as artificial intelligence continues to drive the S&P 500 and Nasdaq as leaders of global equity markets.
Structurally, the dollar remains an expensive currency, and with concerns over the end of U.S. exceptionalism having largely subsided for now, its valuation will depend primarily on inflation-adjusted interest rate differentials.
The yield curve still implies one additional rate hike between October and December. Lower oil prices will reduce inflation expectations while supporting corporate profit margins. However, accumulated supply shocks—including tariffs and higher energy costs—continue to feed through into inflation data. Indicators such as supply chain stress, order backlogs and delivery times suggest that core inflation may peak somewhat later than previously expected. Even so, conditions in the labor market appear to be improving.
The Federal Reserve is likely to maintain a restrictive bias in the coming months, but the most probable scenario is that it remains on hold for the rest of the year—neither raising rates nor cutting them until 2027, when disinflation is expected to resume more forcefully.
There are four reasons why U.S. inflation could eventually surprise to the downside. First, the New York Fed’s inflation gauge suggests that the recent inflation rebound has been driven primarily by supply-side factors. Second, declining crude oil prices should pull inflation expectations lower. Third, distortions resulting from the government shutdown will gradually fade from the data. Finally, the adoption of artificial intelligence is boosting labor productivity at annual rates approaching 3%, while unit labor costs have fallen sharply.
For all of these reasons—and given the U.S. dollar’s tendency to exhibit momentum—it is plausible that the currency could appreciate somewhat further in the short term, as our model suggests. Nevertheless, all indications point to this being an attractive opportunity to reduce exposure to the dollar.