
The Center for Climate Prediction of the National Oceanic and Atmospheric Administration (NOAA) maintained an advisory on the El Niño phenomenon and stated that it is intensifying, with a probability exceeding 90% that a very intense episode will occur during the autumn and winter of the Northern Hemisphere in 2026-27. The starting point for any outlook on the agricultural market facing 2027 is that meteorological agencies have reached a consensus, and have done so with unusual certainty.
The World Meteorological Organization reached the same conclusion on September 3, indicating a probability close to 100% that El Niño will persist during the periods from September to November 2026 and from December to February 2027, with the forecast that the phenomenon will reach a very strong intensity before reaching its peak toward the end of the year. Monitoring data from the Australian Bureau of Meteorology agree: the so-called relative El Niño 3.4 index reached +2.51 °C in the week ending September 13, compared to an El Niño threshold of +0.80 °C, while most models indicate that a maximum exceeding +3.0 °C will be reached and it is forecast that the phenomenon will persist until the autumn of 2027.
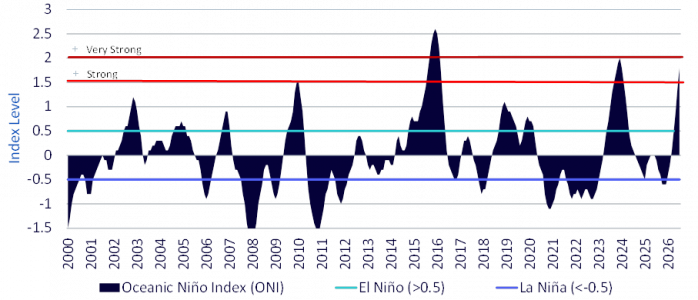
Oceanic Niño Index (ONI), from 2000 to Present. Source: National Oceanic and Atmospheric Administration (NOAA), Bloomberg Finance L.P. and WisdomTree, as of July 31, 2026.
The effects of El Niño on agriculture occur with a delay of between six and twelve months relative to the peak, due to the time it takes for atmospheric changes to modify local climate, affect crop cycles and impact global supply chains. Therefore, an event that reaches its peak at the end of the year impacts more directly the 2026/27 crops that are currently being sown or prepared: the Southern Hemisphere summer harvest, India’s Rabi season, West Africa’s main harvest, and Southeast Asia’s oil palm and robusta coffee cycles. The price impacts of what is happening in the Pacific will be felt mainly starting in 2027.
The Gulf Conflict Has Shifted from Focusing on Energy to Being a Matter of Inputs
The Gulf conflict has lasted seven months now and, instead of stabilizing, it has escalated. The ceasefire agreed upon in April and the memorandum of understanding signed in June were rendered ineffective when hostilities resumed in July. The recent event with the greatest impact took place on September 11, when Saudi Arabia closed its 1,200-kilometer east-west pipeline following a drone attack, which meant the closure of the main route by which Gulf crude bypasses the Strait of Hormuz.
In the agricultural sector, main exposure derives from the trade of fertilizers and raw materials transiting through the same waterway, and it is precisely the difference compared to 2022 that makes it lasting. The war between Russia and Ukraine in 2022 diverted trade flows, whereas this one has diminished productive capacity. It is estimated that 31 ammonia plants across the Middle East have been directly affected or closed down completely; another 49 in South Asia have reduced production or are halted due to raw material shortages; and at least 20 Russian plants have suffered damage due to drone attacks.
Their reactivation will require time and capital far beyond the end of hostilities. Persian Gulf countries account for approximately 43% of seaborne urea exports and 44% of seaborne sulfur trade. Even in the United States, which obtains two-thirds of both its urea and phosphate from the domestic market, 12% of the urea supply and 17% of DAP/MAP (diammonium phosphate/monoammonium phosphate) comes from beyond the Strait. This points to a capacity constraint extending across several seasons, rather than a freight transport issue.
Grains: A Group of Annual Crops That Already Carries a Risk Premium
The energy sector has recorded the largest individual variations of the year 2026, and refined products and crude oil occupy four of the top five spots. However, what is most revealing about the year-to-date performance table is the breadth, rather than the magnitude. Agriculture occupies virtually the entire space of the ranking between rice and sugar.
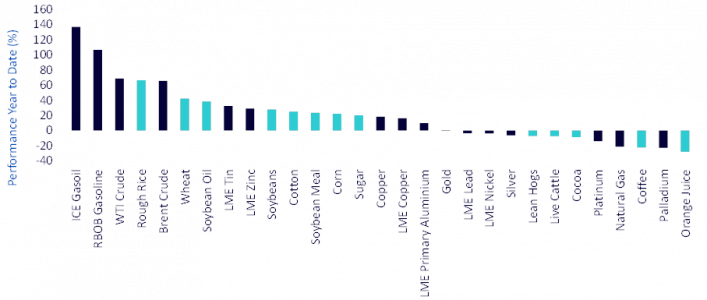
Cumulative Performance Year-to-Date Across Commodity Groups. Source: Bloomberg Finance L.P. and WisdomTree, as of September 21, 2026.
What has driven crops throughout the year has been almost exclusively geopolitical and input factors, rather than weather factors. Wheat is the clearest example: the World Agricultural Supply and Demand Estimates (WASDE) report for September was clearly bearish, as world production for the 2026/27 campaign was revised upward by 3.1 million tons to 822.4 million due to increased harvests in Australia and Canada, and ending stocks were increased by 3 million tons to 276.3 million. However, wheat prices have risen 42% year-to-date, as continued Russian and Ukrainian attacks against Black Sea port infrastructure have disrupted the physical route for nearly a quarter of world wheat exports. Net speculative positioning in wheat increased 130% last month, reflecting an improvement in confidence regarding this grain. For this commodity, the structural outlook could depend on whether the current risk premium proves persistent, rather than sporadic. Black Sea infrastructure has now become a recurrent target, rather than representing a one-off disruption, and Australian wheat is in the highest exposure band to El Niño for the 2026/27 harvest.
On the other hand, corn markets are highlighting a genuine supply contraction. U.S. production for 2026/27 was cut by 5.4 million tons to 401.3 million due to hot conditions and uneven rainfall. Global production was reduced by 7.9 million tons to 1,291 million, and global ending stocks fell by 2.6 million tons to 272.1 million. Net positioning increased 92%. In the case of corn, the argument that has been made for years is the constraint in inputs. Corn is the most nitrogen-intensive crop, and fertilizer prices are projected to remain above pre-conflict levels until 2028. Where prolonged under-application of phosphate and potassium is already observed, doses have decreased between 10% and 15% in recent years. Consequences on yield manifest with a three-year lag. This is a slow, cumulative drag that affects the yield trend, rather than a one-off single-season disruption, and is the mechanism by which this conflict extends beyond itself.
Meanwhile, the soybean sector has been driven more by demand than supply. The United States Department of Agriculture (USDA) has raised U.S. production to 123.4 million tons, but China has already purchased nearly 13 million tons this season, representing more than half of its annual commitment of 25 million tons, valid until the year 2028, in addition to a broader commitment to purchase $17 billion worth of agricultural products. China’s purchase commitment extends until 2028 and could provide some demand support that depends less directly on weather conditions. The reason for short-term caution is stocks: soybean and soybean oil reserves stand 7.9% and 8.5% above their five-year seasonal averages. Soybean oil features an additional and underappreciated support factor in the energy context: with crude oil above $100, biofuel demand could strengthen the vegetable oil sector independently of oil production.
Soft Commodities: The Sector Where the Meteorological Signal Is Least Reflected in Prices
The cumulative year-to-date performance table makes it clear. Sugar is up 20%, cotton up 25%, but cocoa is down 9%, coffee down 22%, and orange juice down 28%. The soft agricultural products sector, which historically has shown the greatest sensitivity to El Niño, has been the weakest link in the agricultural sector this year.
The exception is sugar and the clearest expression of the double impact. In early September, raw sugar was trading at 18.44 cents per pound, near the 16-month high located at 18.77 cents, as supply reduction reinforced expectations of a deficit in the 2026/27 campaign. Production in center-south Brazil fell 7.9% during the first half of August, and high energy prices continue to encourage mills to prioritize ethanol over sugar. India has authorized the duty-free import of one million tons of raw material, while drastically reducing ethanol diversion, a combination of measures suggesting domestic stocks are tighter than official figures indicate. Monsoon rainfall has been significantly below normal in Maharashtra, Karnataka, and Marathwada, regions representing close to one-third of Indian production. Sugar is affected by both meteorological conditions and energy price pass-through, and holds the thinnest inventory cushion among major soft agricultural products.
Cocoa is the crop generating the most controversy. Prices have recovered strongly since the low recorded in the second quarter, with New York futures standing around $6,250 per ton, and rainfall in West Africa during the August mini-drought was well below normal levels for this time of year, representing a real risk to pod survival and main crop development if rain does not fall. In contrast, the stock situation is fundamentally different from that of 2023/24. ICE-certified stocks have recovered to near their two-year high, while European cocoa grindings in the first quarter fell 4.6% year-on-year to reach their lowest level in 17 years. The cocoa sector faces this El Niño episode with reserves it lacked two years ago, and with demand clearly damped by the previous price crisis. The bullish thesis is based on weather conditions overcoming those reserves; it is not the same strategy as in 2023.
Regarding Arabica coffee, it faces improving supply: the Brazilian harvest is well advanced and revised export registry data indicate significantly higher flows than previously reported. Certified stocks remain near multi-year lows and physical availability is tight, but the supply trend is positive. The Robusta variety is the most interesting investment. It has been trading near multi-month lows, around $3,296 per ton, precisely as drought spreads across Indonesia and Vietnam during a critical flowering period. Since coffee is a perennial plant, damage suffered during flowering affects the 2027/28 crop, not the current one. Robusta coffee prices stand near their recent lows, even though major producing regions lie in the highest exposure band to the El Niño phenomenon. This creates a divergence between current prices and potential meteorological risks threatening supply.
For its part, cotton is up 25% year-to-date and is the commodity most dependent on demand. Recent price evolution has been downward due to improving U.S. crop conditions, declining export sales, and a strengthening dollar. The curve is in contango, somewhat steepened compared to wheat or corn, which contrasts with cotton stocks being the tightest of the group seasonally. That divergence highlights that the market is placing more weight on current crop conditions than on previous harvest scarcity, and that should a weather disruption occur in 2027, there would be very little margin for error. However, the long-term evolution of cotton is more closely tied to global textile demand and the dollar than to the Pacific region.
Conclusion
Two disruptions impact the same production window from different directions. The Gulf conflict increases cost and limits availability of inputs used prior to the 2026/27 campaign, doing so over a multi-year horizon, as damage affects production capacity rather than trade routes. El Niño increases the likelihood that the yields those inputs aim to protect fall below trend, with a lag in market transmission between six and twelve months relative to the oceanic peak, meaning its effects will be felt mainly in 2027.
The intensity of El Niño and its regional meteorological effects could differ from current forecasts, while an easing of geopolitical tensions could reduce pressure on energy and fertilizer markets. Better-than-expected harvests, inventory replenishment, lower demand, or changes in government policy could also offset pressures arising from meteorological conditions and input costs, resulting in commodity price performance different from that analyzed above.