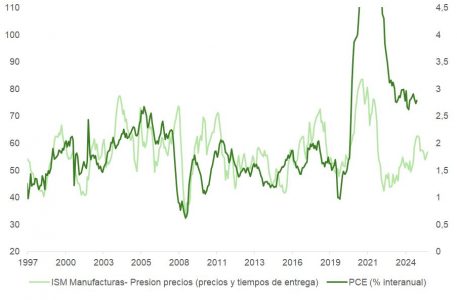
The first data of the year begins to confirm the impact of monetary and fiscal stimulus accumulated in Q4 2025. In particular, the January ISM Manufacturing survey delivered a positive surprise by returning to expansion territory with a reading of 52.6, breaking a streak of 10 consecutive months of contraction.
The rebound is supported by solid fundamentals such as:
New orders surged to 57.1 (an increase of around 10 points).
Production also posted a strong recovery.
Delivery times lengthened, consistent with stronger demand traction.
The “new orders – inventories” spread, a leading indicator of activity, accelerated after a flat 2025.
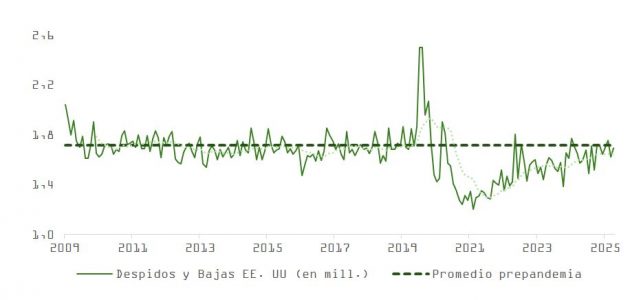
The employment subcomponent surprised to the upside, although it remains in contraction (48.1). This reinforces the perception of labor market stabilization, in line with recent jobless claims data. However, the figure does not yet confirm a sustained turnaround in manufacturing employment and therefore does not justify a hawkish shift from the Fed.
Labor Market in Progressive Normalization
The December JOLTs report, delayed due to the partial government shutdown, points to stability with nuances of weakness. Job openings declined, although voluntary quits edged up slightly (from 3.19 to 3.2 million), while layoffs did not worsen. The labor market remains in a post-pandemic normalization phase, with structurally lower demand in light of productivity gains.
Inflation: Mixed Signals and Need for Monitoring
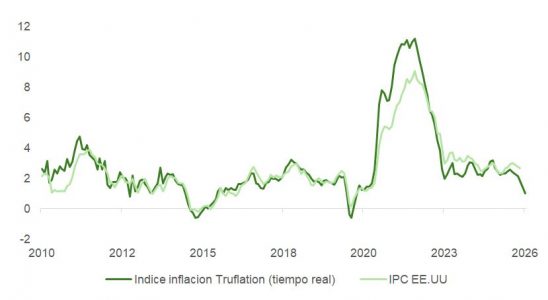
The ISM also provides insights into price dynamics. While the prices paid series remains stable, the lengthening of delivery times could indicate early signs of price pressures. This remains an isolated data point, but given the acceleration in growth, it is advisable to monitor for potential second-round effects. The real-time inflation indicator from Truflation continues to trend downward, supporting our thesis of progressive disinflation.
However, a sharp shift in the growth outlook or a negative ruling by the Supreme Court regarding the use of tariffs could put pressure on yields and affect risk assets through:
Increased rate volatility
Less room for Fed rate cuts
Repricing of valuations
For this reason, we maintain a neutral view on equities, awaiting the right moment to increase positions.
Severe Correction in Software Within the Tech Sector
The week was also marked by a sharp correction in the technology sector, particularly in software. Despite the structural strength of the AI investment cycle, software companies experienced a capitulation session on Tuesday, with market capitalization losses exceeding $300 billion.
The decline was triggered by:
New functionalities announced by Anthropic CoWork
Comparisons to the impact of DeepSeek in 2025
Fears of disruption to SaaS models and per-user licensing
Initial drops concentrated in firms such as RELX, S&P Global, Thomson Reuters, and Legalzoom.com, later spreading across the sector and to private equity firms with significant exposure
However, the mass selloff appears to be driven more by panic than objective analysis. Disruption risk is real, but many stocks are already trading at decade-low multiples after a roughly 40% valuation compression. At these levels, much of the potential impact appears to be already priced in.
AI and CapEx: The Cycle Continues
Our view that 2026 will not be the year the AI bubble bursts is further reinforced. Hyperscalers are not only continuing to expand their computational capacity but are also significantly revising their investment plans upward. Alphabet now targets $180 billion, up from the previously expected $116 billion, while Amazon raises its estimate to $200 billion from the previous $150 billion. Altogether, AI investment could exceed $700 billion in 2026.
Toward a Less Concentrated Market
With more dynamic economic growth, the door opens to a more balanced market, where returns are no longer so heavily concentrated in technology and communications. The growing divergence in performance, and valuation, between winners and losers within the AI universe points to increased market selectivity.
The recent decline in software may have been the first step toward a broader rotation: from defensive growth to cyclicals, and from thematic concentration to structural diversification.
In conclusion, the ISM data signals the beginning of a new phase in the economic cycle, with manufacturing emerging from contraction and AI investment far from exhausted. However, concerns around inflationary pressure could resurface, requiring tactical caution and balanced portfolio construction. The key for 2026 will be clearly distinguishing between real opportunities and speculative noise surrounding disruptive technology.
Dynasty Financial Partners has announced the successful closing of a minority capital round, backed by its community of stakeholders, including employees, clients, and partners, as well as several long-term investors and members of its Board of Directors. According to the firm, investors in the round include The Charles Schwab Corporation, BlackRock, J.P. Morgan Asset Management, Abry Partners, Glick Family Office, and Dynasty Chairman Harvey Golub, along with various clients. Fortress Investment Group LLC participated as a new investor. This marks the sixth capital round since Dynasty’s founding in 2010.
The funds raised in this round will be used to strengthen support for Dynasty’s network of partner firms, enabling them to better serve their clients. In particular, they will drive continued growth in talent and advanced AI-driven technology, facilitating the integration of Dynasty Desktop and Core Services; enhance the firm’s investment platform with a focus on private investments and its comprehensive Outsourced Chief Investment Officer (OCIO) services; provide additional growth capital to drive mergers and acquisitions within the network; expand Dynasty Investment Bank; and reinforce Dynasty’s strong balance sheet, positioning the firm to proactively capitalize on future opportunities.
“The future is bright for Dynasty and our network of independent advisors, thanks to the remarkable alignment within our ecosystem, as reflected in this investment round. As more advisors recognize the benefits of being independent RIA advisors, and more RIAs understand the power of outsourcing to grow their businesses, we are committed to ensuring they have every opportunity to build better firms while delivering exceptional care to their clients. We are investing in the best technology, talent, and resources, while strengthening our solid balance sheet to support our clients’ growth ambitions, whether through M&A or succession planning. I am deeply grateful to our investors, team members, industry partners, and clients who have supported us since Dynasty’s early days, making today’s announcement possible,” said Shirl Penney, Founder and CEO of Dynasty.
Dynasty’s network is primarily composed of clients who own and operate independent Registered Investment Advisors (RIAs). These RIAs typically hold majority ownership, control their own economics, own their ADV filings, and have the freedom to manage their client experience model. These clients leverage Dynasty’s integrated technology, services, robust Turnkey Asset Management Program (TAMP), digital lead-generation services, capital solutions, and investment bank.
This integrated RIA platform model provides synthetic scale, allowing RIAs supported by Dynasty to be “Independent, but not alone.” Currently, Dynasty has 58 partner firms in its network, representing over 500 advisors and managing more than $125 billion in platform assets.
In October 2024, Dynasty closed a minority capital round backed by several of its long-term investors and board members, along with three strategic investors, including existing investor The Charles Schwab Corporation and new investors BlackRock and J.P. Morgan Asset Management. While Dynasty currently carries no debt, the firm secured a $125 million corporate credit facility in 2025, backed by a syndicate of financial institutions including UMB Bank, N.A., Flagstar Bank, J.P. Morgan, Citibank, N.A., and Goldman Sachs Bank USA.
“This latest investment round reflects the incredible momentum of the independent movement within the financial advisory industry. The growth of the RIA space is driving positive change for advisors and their clients. Together with the other board members, I’m excited to continue supporting Shirl and the leadership team as they guide our growing network of independent advisors,” added Harvey Golub, Chairman of the Board at Dynasty.
China’s strong close in 2025 keeps the country’s outlook firm for 2026 and its growth target around 4%-5%, driven by technological innovation and investment. Looking ahead to next year, some of the tailwinds expected to support the Asian giant include stronger domestic consumption and improved diplomatic relations with the U.S.
“Although these factors could support the Chinese stock market, policy missteps are always a risk, and companies and consumers should play a leading role in driving growth,” note sources from KraneShares.
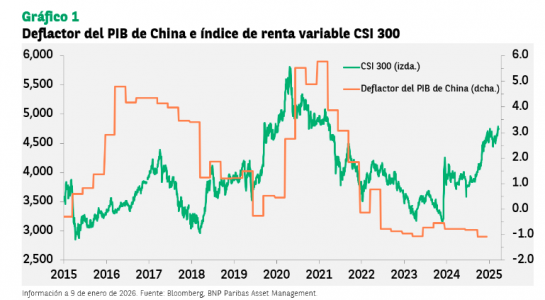
Macroeconomic Data: The GDP Deflator
According to Robert Gilhooly, senior economist specializing in emerging markets at Aberdeen Investments, the set of easing measures announced in recent weeks, along with the signal that cuts to key interest rates will occur in due course, will help underpin real GDP growth in 2026.
“However, the outlook for nominal growth may remain more challenging, as illustrated by the record streak of 11 consecutive quarters of negative growth in the GDP deflator. In fact, although recent data on fixed asset investment points to some success in reducing investment in the automotive industry, the economy-wide overcapacity is likely to continue weighing on inflation, partly because the People’s Bank of China (PBOC) appears more willing to allow greater appreciation of the renminbi. The large number of maturing fixed-term deposits opens the door to further interest rate cuts, while protecting banks’ net interest margins (NIM). A key question is whether these significant household savings will flow into the stock market; however, it is likely to be very difficult to spark a slow bull market,” Gilhooly concludes.
In this regard, Ecaterina Bigos, Chief Investment Officer for Asia excluding Japan at AXA IM Core (part of BNP Paribas AM), believes the country’s GDP deflator remains firmly in negative territory, falling for the third consecutive year, marking the longest stretch of broad price declines since the late 1970s.
“For equity investors, the GDP deflator is a key indicator for assessing corporate performance, profit growth potential, and overall market conditions. Despite signs of rising inflation, China continues to face various deflationary pressures. The country’s economy, which has been impacted by the decline in the real estate market and weak consumption, has struggled to emerge from the deflation recorded since the end of the pandemic. Overproduction in certain sectors has led to an oversupply of goods, forcing companies to cut prices to stay afloat,” explains Bigos.
Betting on Technological Innovation
In this context, KraneShares expects China’s 15th Five-Year Plan, scheduled for release in the first quarter, to support the development of high-tech industries, increase technological self-sufficiency, and stimulate domestic demand and inflation. “Efforts to curb overcapacity and downward competition, especially in the solar panel industry, could bear fruit in 2026, potentially resulting in improved corporate profit margins and inflation,” they add.
For now, the draft of this plan suggests that technological innovation and broad economic expansion are key priorities. At the same time, behind the scenes, top government leadership is paying close attention to the growth of domestic consumption.
Focusing on the main goals outlined during the 2025 Central Economic Work Conference (CEWC), an annual economic meeting involving President Xi and the State Council—KraneShares experts highlight deepening the expansion of the “Artificial Intelligence +” policy; reforming policies to support high-quality development while correcting destructive competition; and stabilizing the real estate market through city-specific policies to optimize housing supply, including purchasing part of the existing commercial housing stock for affordable housing use.
“In December, President Xi published an article titled Expanding Domestic Demand Is a Strategic Move. In it, he stated that ‘expanding domestic demand is related to both economic stability and economic security,’ and that domestic demand will be supported, among other measures, by ‘promoting employment and improving social protection,’” they add.
The Relationship with the U.S.
KraneShares experts believe that the restart of diplomatic relations between the U.S. and China could bring greater clarity to global export markets for Chinese goods, the status of their ability to import high-end chips, and reduced volatility in equity markets, especially abroad.
“We believe markets are underestimating President Trump’s desire to reestablish U.S.-China relations. We are optimistic that the trade and national security measures already implemented or underway could give the Administration the confidence to work toward improving long-term relations,” they note. These measures include reshoring automobile manufacturing and other critical industries to the U.S., as well as export restrictions on chips.
“We believe President Trump may expand the trade truce established with President Xi during their meeting in South Korea earlier this year. Although we may see tougher legislative initiatives in Congress, such as the BIOSECURE Act, we think it is unlikely these will seriously derail the White House’s efforts,” they add.
Implications for Chinese Equities
Without a doubt, 2025 was a strong year for Chinese equities, driven by improved confidence, especially in growth and technology sectors. Many investors reallocated their portfolios during the year, although some remain on the sidelines, particularly U.S. investors sensitive to geopolitical headlines. And despite the challenging macroeconomic environment, Chinese equity markets posted returns above 10% in 2025.
In Bigos’ view, this divergence from macroeconomic trends may be due to the strong performance of sectors such as technology, thanks to advances in artificial intelligence, as well as biotech and others that also benefit from anti-involution initiatives. “Moreover, the increase in liquidity has supported the revaluation of companies, as savings have been redirected into equities: a dividend yield more attractive than deposit interest rates is drawing investors. Meanwhile, fixed income returns have declined, market volatility has increased, and the real estate market remains weak, prompting investors to seek alternative investment avenues,” she explains.
Looking ahead to this year, KraneShares experts believe that the 15th Five-Year Plan’s focus on technological self-sufficiency, anti-involution policies that improve corporate earnings, and increased consumer spending will allow for a strong year in China’s equity market. “Meanwhile, we believe the Trump administration will seek to move forward with the reestablishment of diplomatic relations with China, reducing headline risks and allowing some U.S. investors to reallocate their investments,” they emphasize.
For the AXA IM expert (part of BNP Paribas AM), weak confidence in the private sector and among consumers, along with supply-demand imbalances, increasingly limit the potential for reflation and, ultimately, corporate profits. “Reviving domestic demand is essential to achieve sustained long-term growth, but it will still take time to redirect the economy toward higher consumption levels. For now, economic policy remains focused on an investment- and trade-driven growth model, with an emphasis on developing a modern industrial system and achieving technological self-sufficiency. In this context, investors should pay close attention to those areas that benefit from this policy direction and from technological innovation,” concludes Bigos.
Omnibus accounts are one of the central tools in fund distribution, but also a key element when it comes to money laundering. Their main advantage is that they are accounts opened in the name of a financial institution in which the investments of multiple clients are pooled. And although the positions are jointly recorded, the financial institution that holds the omnibus account maintains at all times an individualized internal record that allows the identification of which investments belong to each investor.
This structure explains their relevance for international fund managers. “This system facilitates operations in certain products and markets and is especially common when investing in foreign markets, where institutions usually operate through sub-custodians,” says Maite Álvarez, Director of Financial Regulation at finReg360.
Álvarez acknowledges that there are also drawbacks: “There may be temporary limitations in the availability of financial instruments or in the exercise of the rights associated with them. For this reason, it is essential that investors know whether their investments are channeled through this type of account and are aware of the risks involved.”
However, the balance is clear for asset managers: these types of accounts simplify administrative management and are highly operationally efficient. “For both reasons, the trend we see among managers is to continue using them, while also working to provide these accounts with greater traceability and cooperation among the various actors in the chain. The goal is to combine commercial efficiency with effective control of money laundering risk,” states José Antonio Tuero, Partner of Criminal and Compliance Law at Andersen.
The Chain Links
When it comes to anti-money laundering (AML), the debate centers on who should be responsible for these obligations when distributing third-party funds through these accounts. According to Tuero, there should be no issues because “each part of this chain has a defined area of responsibility for which it is accountable.”
He acknowledges that this may create the impression of diluted responsibility, but insists that the key is for each link to fulfill its own AML obligations: “It is important to remember that we are talking about responsibilities and duties that cannot be contractually transferred to a third party. If we had to identify the most sensitive part of this chain, we could say it is the last link, the one directly in contact with the end client.”
So, how does it work and who conducts due diligence? According to Martín Litwak, CEO of Untitled Collection, we are dealing with an omnibus account opened at any regulated institution, broker, investment fund, etc., where the account holder is the intermediary. “It is important to note that for many years, large global investment managers have used this system for investment accounts, which generally carry a low regulatory risk profile. The problem now is that they are starting to be seen in commercial or transactional accounts,” he clarifies.
Regarding due diligence, he adds: “In theory, it should be the same, but instead of falling on the bank where the omnibus account is held, which will perform its due diligence, but more lightly, since its client is a regulated entity, it falls on the intermediaries, who generally have fewer resources.”
Although this may seem like a “weak link” in the chain, the regulations are clear and increasingly converging. According to Pilar Galán, Partner in Charge of the Asset Management Sector at KPMG Spain, “In the distribution and marketing of investment funds, AML/CFT responsibility lies primarily with the entity that maintains the direct relationship with the end investor. This intermediary, usually the distributor, is responsible for fulfilling identification, verification, and monitoring obligations.”
Galán clarifies that in omnibus models, where the manager only sees a platform as the account holder and not each individual investor, AML obligations toward the investor still fall on the distributor. “The manager performs due diligence on the platform as an institutional client but does not identify the investors behind the intermediary,” she adds. Álvarez also points out that, since the manager lacks individualized client information, the AML obligations fall to the distributing entity, which knows and directly interacts with the investor.
This means that the fund manager typically does not perform KYC on the end investor when the fund is distributed through third parties. However, the manager still has AML/CFT responsibilities. “These focus on managing the laundering risk associated with the fund vehicle itself, defining internal policies and controls, and properly supervising the network of distributors involved in marketing. To do this, the manager must conduct periodic due diligence on these intermediaries and ensure they are correctly applying due diligence measures. Only if the manager sells the fund directly to the investor does it assume onboarding and KYC of the final client,” adds Galán.
In Litwak’s view, the conclusion is clear: “There is often a perception that offshore or cross-border alternatives are chosen to hide, but generally they are selected for their simplicity, flexibility, and legal certainty. History, especially recent history, has shown that financial crimes occur onshore, not offshore.”
Regulation, Supervision, and New Frontiers According to these experts, it is true that regulators are increasingly concerned about the lack of transparency in certain fund distribution structures, especially when multiple intermediaries are involved and omnibus accounts are used, as these structures can make it difficult to identify the end investor and obscure the origin of funds. In fact, regulators such as the SEC have intensified oversight of transactions carried out through omnibus accounts, particularly those involving foreign intermediaries.
“They are also increasingly worried about insufficient oversight that some managers exercise over distributors and platforms, even though these intermediaries are the ones actually conducting KYC and investor monitoring. The growing complexity of platforms and structures has raised supervisory expectations, which now require stronger controls and greater clarity on who is responsible for what in the distribution chain,” says Galán. In this regard, regulators are focusing on international custody chains and the need to improve ultimate beneficiary traceability, especially in omnibus structures. “They aim to prevent the distance between investor, distributor, platform, and manager from creating AML/CFT responsibility gaps,” she notes.
According to Maite Álvarez, “we anticipate a general tightening of governance and control requirements when financial institutions rely on third parties for client services. In light of this, financial institutions may in the future have to apply enhanced selection, due diligence, and ongoing supervision processes to sub-custodians or management companies, that is, to the entities where omnibus accounts are opened.”
As Tuero recalls, there is no fully unified international legislation, but there is a clear convergence in regulatory criteria. In his opinion, the next major frontier in AML lies in the field of cryptoassets. “In Europe, the requirements focus on eliminating effective anonymity in transactions through the regulation of service providers and the traceability of movements, which in practice represents a very significant shift from the original spirit in which these assets were created,” he concludes.
The recent approval of BICE US as a Registered Investment Adviser by the SEC marks a turning point in the institution’s strategy in the United States. “In sophisticated markets, regulation is a key reputational asset,” stated Patricio Ureta, Managing Director, Country Head of BICE US, the platform of the Chilean financial group, emphasizing that the authorization not only expands the company’s operational reach at the federal level, but also strengthens its institutional positioning within the US Offshore ecosystem, as they continue to observe a “structural trend toward the international diversification of assets.”
In an interview with Funds Society, the executive highlighted that from an operational standpoint, SEC registration allows the company to operate throughout the United States, interacting with “global counterparties under a fully recognized regulatory framework.” From a regulatory perspective, it also entails adhering to “the most demanding market standards and to ongoing compliance obligations, in line with international best practices.”
A Reputational Asset for Clients and Counterparties
Beyond the operational impact, SEC approval carries significant weight in terms of credibility. According to Ureta, the registration serves as “a seal of institutional trust, particularly relevant for Latin American clients seeking to structure and manage their wealth in the United States under top-tier standards.”
“For our counterparties, custodians, managers, brokers, and international asset managers, it reinforces the credibility, transparency, and strength of BICE,” he added.
The new regulatory status opens up opportunities to deepen BICE US’s participation in the offshore ecosystem, supporting clients in processes of international diversification, wealth structuring, and access to global opportunities, the executive noted.
“It allows us to move toward more complex advisory mandates,” he explained, “work with family offices, and access alternative managers or co-investment structures, always within the U.S. regulatory framework.”
As a financial group, BICE focuses on corporate banking, investment banking, asset management, and wealth management, primarily oriented toward institutional clients, companies, and high-net-worth individuals. It is part of the Matte Group and, in recent years, has strengthened its international strategy, particularly through BICE US, its U.S.-based platform, from where it serves Latin American clients within the US Offshore ecosystem.
Proximity With Institutional Backing In a highly competitive market, BICE US seeks to differentiate itself from both large global banks and independent boutiques. Compared to the former, it offers a more personal, flexible, and customized model, while compared to the latter, it brings scale, regional experience, and a solid institutional platform, Ureta detailed.
At this stage, the focus is on HNW and UHNW clients, as well as family offices with sophisticated needs. The firm offers these clients personalized advisory mandates and solutions that integrate wealth planning, alternative assets, and coordination with legal and tax advisors across different jurisdictions.
“We operate under an open architecture model, with a strong focus on fiduciary advisory. This allows us to select products and managers based on the client’s profile and objectives, without conflicts of interest,” the Managing Director explained.
“Guidance is central,” he continued. “It’s not just about building portfolios, but about supporting long-term wealth decisions, especially in contexts of volatility or regulatory and personal changes.”
Investment Trends: ETFs and Alternatives
Ureta noted that today’s clients are “more informed, demanding, and globalized.” In his view, this creates opportunities for platforms like BICE US, which can offer financial education, access to sophisticated products, and strategic support beyond short-term returns. “We see particular value in our capabilities in wealth structuring, co-investments, and the development of tailored solutions,” he added.
Regarding investment trends, Ureta stated that international diversification into the United States remains structural. In the case of Chile, there have been no significant moves toward capital repatriation following the last electoral cycle, although there have been gradual portfolio rebalancing processes. In the most recent presidential elections, far-right politician José Antonio Kast won the runoff.
Looking ahead to 2026, the executive anticipates that ETFs will continue to play a key role due to their efficiency and liquidity, while alternative assets will keep gaining space in high-net-worth portfolios. Strategically, BICE US will focus on consolidating the platform and scaling in an orderly manner.
“Right now, we are focused on deepening relationships with our clients and counterparties. We are moving step by step,” he concluded.
As Part of the Presentation of Its Annual Results, Gonzalo Gortázar, CEO of CaixaBank, Was Asked About the Institution’s Intentions to Grow Outside Spain, Specifically Regarding the Possibility of Opening a Branch in Miami to Serve the Wealth Management Segment. According to What He Acknowledged, For Now, the Institution Is Analyzing It, but Has Not Yet Made a Decision.
“We Have Not Made Any Decision, and It Would Not Be Anything Significant. We Are Not in a Program of Making Acquisitions and Large Investments Abroad. The Only Thing It Would Be, in Any Case, Is to Accompany Our Private Banking Clients; but It Is Not Something That Has Financial or Material Relevance for the Group,” He Clarified in This Regard.
However, He Did Affirm That the Private Banking Business, Which the Institution Refers to as Wealth Management, Is Strategic and Very Important for CaixaBank. “We Have Many Years of Growth and Innovation, Including Our Opening of a Bank in Luxembourg, Which Is Going Very Well, Where We Now Have 5 Billion Euros, and Which Celebrated Its Five-Year Anniversary in 2025. It Celebrated, Last Year, Its Five Years of Existence. Miami Would Represent an Addition to That Strategy, if We Ultimately Decide That It Adds Value to Our Current Business,” He Stated.
According to Gortázar, There Is Currently a Business Opportunity for Private Banking Institutions: “Evidently, There Is a Flow of Immigration and of People From Latin America to Spain at All Levels, Including High-Net-Worth Individuals. How to Provide Them With the Best Service Is the Only Question We Are Reflecting On. But That Will Not Result in Any Material Investment That Moves the Needle.”
Wealth Management Segment
Currently, CaixaBank’s Wealth Management Business Has an International Presence Mainly Structured From Luxembourg, Where It Has a Specialized Bank (CaixaBank Wealth Management Luxembourg) to Serve Clients With Wealth Management and Investment Needs in an International Financial Environment. In Addition, at the Group Level, Its Presence Outside Spain Is Especially Reinforced in Portugal Through Banco BPI, Which Also Serves High-Net-Worth Clients With Its Local Private Banking/Wealth Offering.
Bitwise Asset Management, a global crypto asset manager with over $15 billion in client assets, has announced the launch of Bitwise Model Portfolio Solutions for Digital Assets. According to the firm, the new model portfolios offer financial advisors a carefully designed investment framework to access digital assets in their clients’ portfolios through ETFs.
This launch builds on Bitwise’s eight-year track record of helping institutional investors gain exposure to opportunities in crypto assets. Specifically, the offering consists of seven models tailored to different investor profiles and risk preferences. The “Core” portfolios provide broad exposure to the crypto ecosystem, while the “Thematic” portfolios are designed for investors looking to fine-tune their exposure and focus on specific themes, such as stablecoins, tokenization, or crypto assets beyond bitcoin.
The firm notes that model portfolios have become an increasingly important tool for financial advisors seeking to leverage third-party expertise when designing client allocations. Between 2023 and 2025, assets linked to third-party model portfolios grew from $400 billion to more than $645 billion, a 62% increase. Models also saw more than $80 billion in net inflows between 2022 and 2024. “Bitwise’s offering allows financial advisors to access thematic crypto model portfolios developed by a specialist,” they state.
The Key to Model Portfolios
Following the announcement, Matt Hougan, Chief Investment Officer (CIO) at Bitwise, stated: “Today is a pivotal moment in the way advisors access crypto assets. Model portfolios are one of the most important ways financial professionals allocate investment across nearly all asset classes, but until now their use in crypto has been limited. As the number and variety of crypto ETPs grows, these expert-built models offer a simple value proposition: they show advisors how to combine the growing number of crypto ETPs in ways that align with specific client goals. They make building a crypto allocation sleeve easy.”
The company adds that Bitwise Model Portfolio Solutions offers additional features, such as portfolios that are systematically monitored and rebalanced to mitigate drift from the portfolio’s target allocation. Additionally, allocators gain exposure through individual, easy-to-integrate portfolio frameworks; and the models are built to provide diversified exposure to the digital asset ecosystem, reducing the risk of concentration in a single asset. Finally, they consider a key differentiator to be that allocators receive clear reporting materials and documentation, simplifying due diligence and client reporting.
Patria Investments has announced the acquisition of WP Global Partners, a U.S.-based private equity solutions manager specializing in the lower-middle market. The transaction strengthens Patria’s local presence in the United States and expands its investment and fundraising capabilities in a market the company considers strategic.
With the completion of the transaction, assets under management (FEAUM) in Patria’s Global Private Markets Solutions (GMPS) segment exceed $13.3 billion, based on pro forma data from the third quarter of 2025. Approximately 40% of investments will now be allocated to assets in the United States.
Founded in 2005 and with offices in New York and Chicago, WP Global Partners has around 30 employees, including more than ten investment professionals, and has already invested over $6 billion across various sectors. The addition of WP’s team and capabilities complements Patria’s private equity solutions business, particularly in primary, secondary, and co-investment strategies.
According to Marco D’Ippolito, Managing Partner at Patria, the transaction broadens the firm’s investment platform. “This is an important step in bringing on board a talented team with a proven track record and strong reputation. The transaction immediately expands our private equity partner universe and enhances our offering in primary, secondary, and co-investment strategies within the U.S. lower-middle market,” he stated.
Donald Phillips, Chairman and CEO of WP Global Partners, emphasized the strategic alignment between the two firms. “After a careful evaluation of potential partners for WP’s next chapter, Patria stood out for its entrepreneurial culture, diversified global platform, and strong focus on the middle market in private equity. I am confident Patria will provide our team and clients with a solid foundation to continue serving our investors effectively,” he said.
The transaction is structured as an all-cash deal, with a base price equivalent to 1.7% of FEAUM, plus an earnout payment in cash subject to performance targets, expected in 2029. Patria stated that the transaction is expected to be accretive to both fee-related earnings (FRE) and distributable earnings (DE) in the first year after closing.
With the addition of approximately $1.8 billion in FEAUM from WP, Patria strengthens its global diversification strategy. The firm now manages over $51 billion in assets across five main asset classes, offering more than 35 investment strategies and over 100 products, supported by 37 years of experience.
Further details on the transaction can be found in the Investor Relations section of Patria’s website. Latham & Watkins served as legal advisor to Patria, while Raymond James & Associates acted as financial advisor. WP Global Partners was advised by law firm Hogan Lovells.
Numerous U.S. asset managers are preparing to create exchange-traded fund (ETF) share classes for their mutual funds, a process that raises logical questions such as the potential of this approach and the challenges its use might present, among others. A study by Brown Brothers Harriman (BBH) examines the pros, cons, and key considerations surrounding the introduction of these vehicles.
In the fall of 2025, the U.S. SEC announced a historic decision that should pave the way for fund managers to offer ETF share classes within existing mutual funds: it granted Texas-based investment firm Dimensional Fund Advisors the right to add ETF share classes to its mutual funds.
With this move, the SEC broke a long-standing market stalemate that could trigger a wave of new ETF share classes for mutual funds. Following this decision, more than 60 sponsors, out of the 80 that initially filed applications, have resubmitted requests for ETF share classes.
Why Now?
At BBH, they explain that the remarkable growth of the ETF industry has led many asset managers to explore ways to design and restructure their mutual fund lineups to offer the benefits of exchange-traded funds. Since the first mutual fund-to-ETF conversion in 2021, conversions have become an increasingly popular approach.
However, this process “can be complicated,” according to BBH, as in some cases “it presents limitations and complexities for distribution,” requiring brokerage accounts for all investors.
Advantages
Allowing a fund to offer both mutual fund share classes and ETF share classes could, according to BBH:
Promote tax efficiency.
Foster a more competitive market.
Enable providers to offer lower fees and real-time trading to clients, while also providing greater portfolio flexibility.
Expand investor options through the development of new products.
For sponsors, ETF share classes offer the potential to:
Demonstrate a broader track record of performance and results.
Extend tax efficiency to a wider group of investors.
Optimize ETF baskets to improve liquidity.
Increase investor access to their investment strategies.
Leverage economies of scale.
Technical Details and Structural Contrasts
The SEC remains particularly focused on ensuring fair treatment for investors across all share classes within this new structure, specifically regarding the cross-subsidization of expenses and the overall tax impact for investors in a common portfolio of assets.
Since most retail investors buy and sell ETF shares from one another on the exchange, ETFs include a mechanism that protects them from a high volume of direct portfolio transactions. Unlike mutual funds, most ETFs can also reduce or eliminate the possibility of capital gains distributions through the in-kind delivery of securities—the mechanism used to create or redeem ETF shares directly with the fund, often referred to as the primary market.
The in-kind delivery process helps limit trading costs associated with portfolio management. In addition, any costs tied to cash transactions are typically reimbursed by an authorized participant. This contrasts with mutual fund portfolio management, where trading costs and taxes are inherent to the structure and shared by end investors.
Finally, ETFs are generally fully invested, whereas mutual fund managers often maintain a liquidity allocation to support efficient portfolio management and fund redemptions. This potential “cash drag” on performance introduces a unique variable when ETFs are part of a multi-share class structure.
Considerations for Launching Share Classes in the United States
1. Distribution: The commercial implications of this structure for a sponsor’s distribution strategy cannot be overlooked, as BBH points out. Distributor platforms “are already examining how to treat multi-share class structures,” where mutual fund and ETF share classes may raise conflicts under Reg BI.
The multi-share class structure promotes a product-agnostic distribution approach, “which offers investors a wide range of options.” However, the inclusion of ETFs may “introduce new channels or investor types (in addition to a new product category) for the asset manager, creating a need for training and education.”
Firms may also consider adding new sales support resources, such as ETF specialists, to provide their teams with in-depth ETF knowledge and effective guidance toward prospective clients in these new channels.
Existing sales compensation plans will need to be calibrated to properly incentivize ETF sales, taking into account the unique structure and distribution dynamics of exchange-traded funds. Sponsors should also carefully consider pricing in relation to other share classes and understand the potential uncertainty around duplicating an investment strategy—now offered as an ETF.
Lastly, conversions or exchanges (when mutual fund shareholders wish to switch to the ETF share class) involve operational complexities that currently lack an industry-wide solution. As BBH notes, due to this complexity, sponsors, distributor platforms, and administrators “will need to collaborate closely.”
2. Outstanding Tasks: To obtain approval, ensure effective implementation, and demonstrate sound governance after launch, the following objectives must be prioritized:
Developing an effective accounting allocation methodology for expenses and taxes at both the fund and share class level (where applicable)
Creating an initial adviser report outlining the expected benefits for investors across all share classes
Building a framework for ongoing governance oversight
Formal board oversight through regular reviews and reports evaluating whether the structure continues to serve the best interests of each share class. This will include analysis of factors such as trading costs, capital gains, and loss of liquidity.
Discipline, Clarity, and Wealth Architecture Return to the Forefront in the Offshore Wealth Management Industry. In an interview with Funds Society, Cristina Acosta, founder and Managing Principal of 5E Wealth, shared her outlook for the coming years: a more professionalized wealth management sector, enhanced by better use of technology and a renewed focus on human connection.
“Well-designed wealth should provide peace of mind and direction,” she stated, as she reflected on the opportunities and challenges shaping the path forward in 2026. She highlighted a growing interest in thematic investments, many accessed through active ETFs, and the evolving role of alternatives as a complement within investment portfolios.
Acosta’s perspective is not shaped by short-term trends but by nearly three decades in the financial industry, including over 26 years dedicated specifically to wealth management. She has guided families and investors through multiple market cycles, crises, periods of exuberance, and structural transitions. That experience strongly informs her emphasis on coherence, discipline, and long-term strategic sustainability.
At the top of her LinkedIn profile is the phrase “wealth with intentionality,” a concept that captures this new chapter for the wealth management industry. “Wealth with intention means making conscious, transparent, and thoughtful decisions, connected to each family’s story and to what they want to preserve over time,” she explained. For Acosta, intentionality doesn’t mean rigidity, but rather purpose: “Directing capital with intention gives clients something incredibly valuable, peace, perspective, and confidence in their long-term decisions,” she said.
Cristina Acosta began her financial career in 1997 while studying at Northeastern University in Boston, joining Fidelity as an analyst on a small team focused on Latin America. This early experience gave her valuable international exposure and led her to participate in key projects from Luxembourg, during a period when Latin American financial markets were undergoing major structural changes and opening up to global institutions and asset managers.
After graduation, she joined J.P. Morgan Private Bank in New York, where she completed the private banking training program and developed a comprehensive view of wealth, working closely with legal, tax, fiduciary, and investment specialists.
In 2004, she moved to Switzerland to join UBS in Geneva, a pivotal experience that deepened her focus on long-term wealth preservation and structural simplicity. It was during this period that she committed to financial education and to using clearer, more inclusive language, particularly for women.
In 2009, she began working independently from Zurich, advising Latin American families for over a decade. In 2024, she founded 5E Wealth in partnership with Bolton Global Asset Management, driven by her belief that independence is essential to aligning interests and designing coherent, personalized wealth solutions.
Investing: Themes, Alternatives, and Risk Management
When it comes to investment opportunities, Cristina Acosta sees growing interest in thematic strategies, many of which are accessed through active ETFs or specialized funds. “Robotics, automation, artificial intelligence, and companies that integrate these technologies are gaining traction,” she noted.
She also highlights the role of alternative assets as a complement to core portfolios. “They’re growing due to the need for true diversification, low correlation, and the search for return sources beyond traditional markets,” she explained. Within this space, she sees stronger potential in infrastructure and secondaries, though she cautions about risks such as “illiquidity, valuation challenges, and overly optimistic narratives.”
From her experience, one of the main challenges remains comprehensive risk management. “I get concerned when I see wealth spread across multiple portfolios at different institutions without a clear global plan. Banks don’t talk to each other, and risks accumulate,” she warned. In this context, the independent advisor plays a key role as a neutral figure who connects and balances the full picture.
Offshore, Regulation, and the U.S. Advantage
Acosta also highlights that the modern offshore space is becoming increasingly regulated and transparent. “There is greater scrutiny and more demanding reporting requirements. Offshore is no longer opaque; it is clear and structured,” she stated in her conversation with Funds Society.
Regarding the United States as a jurisdiction, she emphasized its market depth, rule of law, and access to intellectual and institutional capital. “When used properly, the U.S. offers a very powerful platform for international wealth management,” she noted.
Looking ahead, Acosta identifies three key trends reshaping offshore wealth management from the U.S. The first is the growing institutionalization of the independent advisor. “I see stronger platforms with greater operational and regulatory rigor, without sacrificing independence or flexibility,” she said.
The second trend is the smarter use of wealth technology. “Tools for consolidation, oversight, and risk analysis will enable families and advisors to gain a truly comprehensive view of global wealth, something that was very difficult to achieve until recently,” she explained. For Acosta, the value lies not in the technology itself, but in how it’s applied: “Used well, it reduces operational burden and frees up time for high-quality service,” she noted.
The third is a clear return to the value of human relationships. “Many institutions lost that connection by over-institutionalizing their service. The market is moving toward less unnecessary intermediation and more discernment, structure, and fiduciary responsibility,” she predicted.
More Informed Clients and a New Generational Balance
This shift in the model goes hand in hand with a profound evolution in the profile of UHNW clients and the new generations. “Today, clients are more informed, ask more questions, and are less likely to delegate blindly,” said Acosta. In particular, younger generations value impact, governance, financial education, and flexibility, according to the founder of 5E Wealth.
“Education brings autonomy, discernment, and peace of mind,” she emphasized, especially in the case of women. “An educated client doesn’t necessarily want to manage their wealth alone, but becomes a more responsible and intentional investor,” she explained.
Looking at the cycle, Acosta describes 2025 as a year of transition and adjustment. “After several years of volatility and extreme narratives, many portfolios are in a digestion phase, rebalancing risks, revisiting assumptions, and returning to fundamentals,” she noted. In her view, this is not a year for impulsive decisions, but one for reinforcing structures and discipline.
For 2026, her tone is one of cautious optimism. “I believe interesting opportunities will arise, but selectively, not across the board,” she stated. Families that reach that point with clear goals, solid diversification, and patience will be better positioned. “Staying disciplined and tuning out the noise will be key to capturing value without compromising balance or peace of mind,” she added.