Alberto D’Avenia (Allianz GI): “2020 Will See Full Deployment of Our Service Model and Investing in Our Advisory Approach”
| By Beatriz Zúñiga | 0 Comentarios
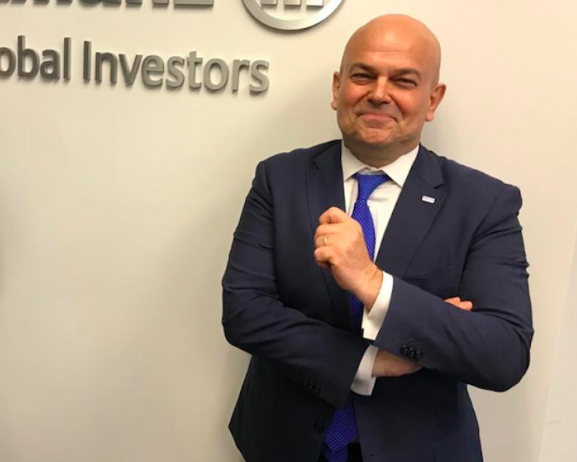
Alberto D’Avenia, Managing Director and Head of US Non-Resident Business (NRB) and Latam Retail at Allianz Global Investors, makes a positive balance of 2019. Throughout the year investor’s main concern has been to achieve returns, and preserving capital. D’Avenia considers that that objective has been fulfilled at Allianz GIobal Investors, where the work they do together with private bankers and financial advisors has been fundamental. This and more in the following interview with Funds Society.
What were the main worries that the investors had this year?
Generating income with capital preservation are in general the 2 main features that non-resident private client in the non-resident business require. The year has been positive even for moderate balanced portfolios, and the average low volatility has had the risk management component take a back seat like it always happens in those occasions, but risk management must keep playing a crucial role in a 2020 year that has the making of a more complex financial scenario.
And how did you manage it?
We have seen favour from clients in our more traditional fixed income and balanced solutions like Income and Growth built to this aim, but we have also worked with our distribution partners to introduce diversification solutions in the liquid alternative space, like our option-based Structured return, providing a favourable decorrelation from traditional markets and absolute return, all weather approach, that we believe will come in handy once volatility spikes.
For the next year (2020), what do you think that will be the principal events to consider? How can you take advantage of it or transform into an opportunity?
We position a trio of major economic and political factors as key events to monitor: US elections, trade developments and central banks liquidity – on a lesser extent, but still significant, we have a second trio made of oil supply, food-security fears and growing US-China competition which could create additional risks for portfolios. This in a 2020 that we see characterised by a deceleration in global growth (triggered by slower US and Chinese economies) and continued uncertainty about how monetary policy and politics will move markets.
These factors will offer a number of “risk-on/risk-off” movements, especially in an era where a single tweet can determine significant volatility shifts; in these occasions, beta returns are normally flat. Hence, risk management will be paramount. In this environment, investors should aim to keep their portfolios allocations consistent to their convictions and actively manage risk – not avoid it. These are, in fact, moments where Money weighted return (what clients are getting out of each own’ s investments) tend to differ from Time weighed returns (returns of investments “on paper”) because of trades dictated by fear and greed. The support of the private bankers and advisers will be paramount to consistent investment approach in those volatile phases, and this is why we keep investing in significant communication on topics like behavioural Finance and risk advisory with our dedicated unit risklab.
Investment opportunities in highly valued markets will be rarer and searching for cheaper ones that also generate return potential from dividends or income might be the right approach. Attractive returns can be pursued from less volatile dividend-paying stocks in value sectors such as energy and from themes that capture global, disruptive trends.
We will keep pursuing the benefit of alternative investments such as private credit, infrastructure debt and equity, and absolute-return opportunities tend to be less correlated to fixed income and equities over time, offering an additional source of diversification potential.
AllianzGI is also a recognised leader in ESG informed and integrated investments; we believe in the merits of long-term sustainability of companies that can be best assessed when incorporating ESG factors into investment decisions.
Choose carefully among over-owned US equities; consider undervalued European stocks and emerging-market debt; look to alternative investments for less correlated returns; keep up the hunt for income against a backdrop of low yields.
Finally, careful on passive investment – their backwards looking nature (indexes and funds tracking them are determined in the past) can be significantly tested by news headlines. They can be part of a general portfolio allocation, but in the light of an actively managed strategy set to invest with conviction
During 2019, which were the most popular funds or demanded by the investors?
As said before those favouring a more cautious approach to high yield like Allianz Short Duration High Income and Global Selective HY, those clearly aimed at a risk managed process to ensure a consistent income, like Income and growth and finally thematic investments, offering access to stories with long-term global growth potential, like Allianz Global Artificial Intelligence.
In this way, what do you think that will be the trend in 2020?
We do not believe private clients (and hence, our distribution partners) needs will change dramatically – probably, after 2019 good results, a more cautious approach will be required but still with income generation at the helm. Diversification and risk management will become even more important going forward.
During this year, did you implement some new services or solutions for the investors?
2019 has been a seminal year, after all our office in Miami has been up and running around summer, so we have invested in establishing our brand and its core value proposition: partnership approach oriented to advisory and consultative partner relationships, risk management support with our dedicated unit risklab, ESG integration in our investment process. As far as investment solutions go, we have positioned Allianz Structured Return (it is more a suite of solutions than just one fund, that is the pure portable alpha strategy) and we believe it will be a real game changer especially in high volatility scenario going forward. Same for our socially responsible solutions (SRI) which are available by the main platforms our partners work with, Pershing and Allfunds bank.
Do you have any plan or idea to develop new services for the clients?
If 2019 has been the year of fitting in the market, 2020 will see full deployment of our service model. We have ambitious plans of investing with our partners in our advisory approach, putting risklab, our ESG research and behaviour finance at the core of our offer, together with our best investment solutions.
As a company, what have been your main successes this year?
Our main goal this year has been positioning our brand in the full US non-resident and Latina America Wealth management markets, and our decision to open an office in Miami has been crucial to that. We have signed a number of new distribution agreements with US local independent and Latin America partners, and we have been able to increase the level of cooperation with those we were already working with. Due to our physical absence from the market, we were being looked at in terms of “best of” investment opportunities in our Ucit and while we are obviously thrilled to be able to provide the market with best in class funds, our partnership approach and the richness of above described solutions is now fully available to our partners, getting our relationships to the next level.


 In this respect, in August, they defined their ‘late cycle slowdown’ scenario as a world where the Global PMI was below 50, global EPS growth was somewhat negative and US core inflation was materially below target at 1.5%. “That was fairly close to the economic reality at the time and yet, under that scenario, we forecast equity returns of only a further 5% decline”.
 “Despite this scenario being more optimistic than a continued slowdown, the rally we have already seen leaves us forecasting only a further 5% upside in the US, Japanese and European equity markets in the near term”. If growth does improve, the asset manager sees potentially more upside in UK and EM equities (10-20%) given their more elevated risk premiums.