Quality Of Life, Salaries, And Housing: The New Map Of Global Metropolises
| By Amaya Uriarte | 0 Comentarios

| By Amaya Uriarte | 0 Comentarios
| By Amaya Uriarte | 0 Comentarios

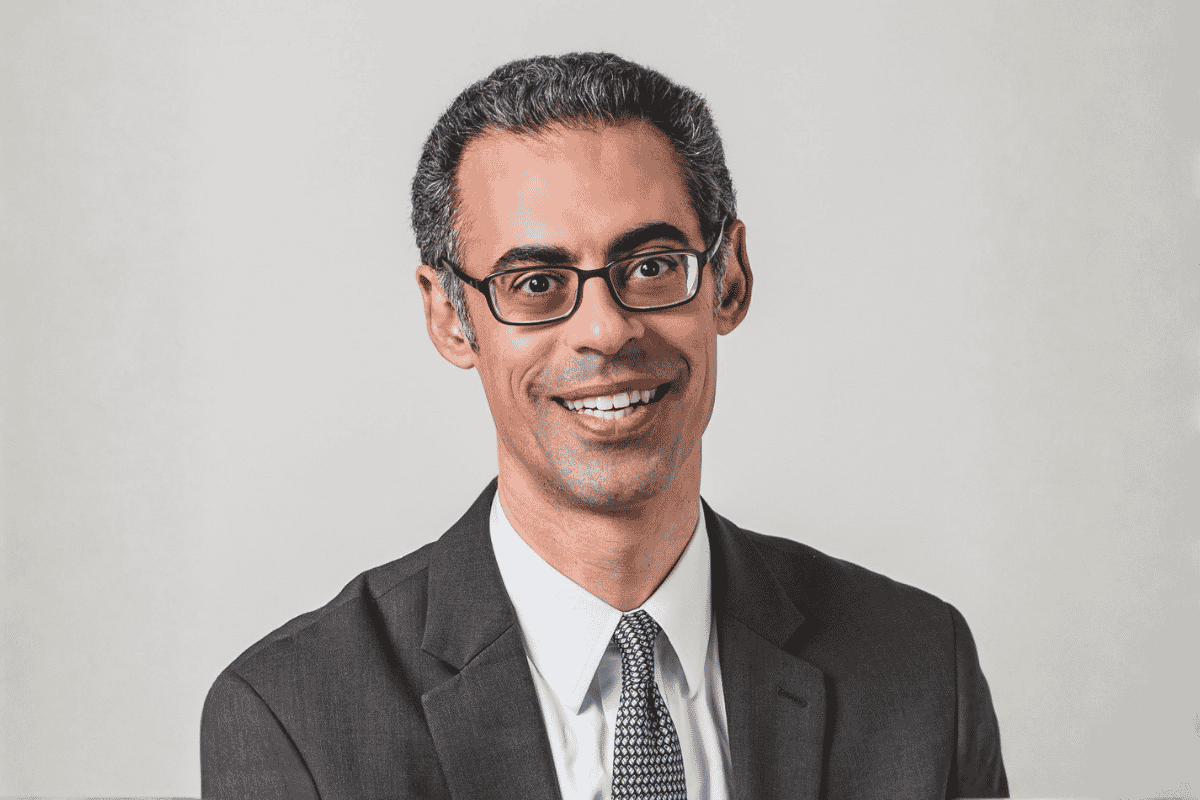
Infracapital, M&G’s infrastructure equity investment platform—integrated within its Private Markets division with £81 billion in assets under management—has appointed John Bruen as the firm’s new head. He will join on September 1 and report to Emmanuel Deblanc, Chief Investment Officer of Private Markets at M&G Investments.
According to the company, John brings over 25 years of international infrastructure investment experience. He joins from H.I.G. Capital where, as Managing Director and partner, he helped establish the firm’s infrastructure platform and raise its first value-add infrastructure fund, which reached $1.3 billion. He also possesses extensive experience investing in and managing portfolio companies across the infrastructure sector, having previously worked at Macquarie Asset Management and Ferrovial Airports.
He will succeed Martin Lennon, who is retiring after a career of more than 36 years in the industry. Since co-founding Infracapital in 2001, he led its growth into one of Europe’s leading middle-market infrastructure investors. Under his leadership, Infracapital raised over £9 billion across a series of dedicated funds investing in essential infrastructure across Europe, through public-private partnerships, brownfield infrastructure assets, and greenfield projects spanning energy, digital infrastructure, transport, and utilities.
Infracapital notes that at a time when Europe seeks to strengthen its energy security, accelerate decarbonization, drive digitalization, and foster economic growth, the company plays a prominent role in financing and developing the essential infrastructure on which communities and businesses rely.
“John is a highly respected leader in the infrastructure sector, with an outstanding track record in investing and building businesses. His combination of investment expertise and leadership capabilities, alongside his strong industry relationships, position him exceptionally well to lead Infracapital into its next phase of growth at a time when demand for investment in essential infrastructure continues to rise across Europe. I would like to thank Martin for his extraordinary contribution to the business over the past 28 years. Under his leadership, Infracapital has established itself as a trusted partner for both investors and portfolio companies, while playing a pivotal role in developing the infrastructure investment sector in Europe. Martin will remain actively involved during the leadership transition process, working closely with the team to ensure a smooth handover and continuity for clients and stakeholders,” highlighted Emmanuel Deblanc, CIO of Private Markets at M&G Investments.
For his part, John Bruen stated: “As demand for infrastructure continues to grow, driven by the energy transition, digitalization, and the need to modernize critical assets, the market presents significant long-term investment opportunities. Infracapital’s investment approach, deep sector expertise, and strong track record place it in a privileged position to capitalize on these structural trends. I am excited to work alongside the team to build on these strong foundations and continue generating value for our investors and stakeholders.”
“I am proud of what we have built at Infracapital over the past 25 years. Our success has been made possible thanks to the contributions of numerous highly talented professionals, both past and present, and the trust our clients have placed in us. Together, we have helped transform infrastructure investing from a niche strategy into an established asset class for institutional investors, and it has been a privilege to experience that evolution firsthand. I retire with peace of mind knowing that the firm is in an exceptionally strong position for the future,” added Martin Lennon regarding his departure from the firm.
| By Amaya Uriarte | 0 Comentarios

The US stock market broke all its trading records on October 8, 2025: according to SEC data, volume reached 6.26 million orders in that single session, making it the highest-volume trading day in history since data collection began in January 2012. In 2026, we could be on track to break that record (the US regulator only provides data through December 31, 2025), driven by the sharp spike in volatility brought about by the war between Iran and the United States, which has triggered severe periodic corrections. However, who is actually moving the equity markets? Have stock market dynamics changed? And, most importantly, how are active management firms adapting to this new reality?
“Twenty years ago, it was big asset managers who could engage in price discovery; they were the ones moving the market. But the market has changed a lot, and now it is retail investors and hedge funds setting the rules of the game, and we should admit it,” reflects Huseyin Turan, portfolio manager of the J Safra Sarasin Tech Disruptors fund at J. Safra Sarasin Sustainable Asset Management (JSS SAM). Various data sources confirm this manager’s impression.
According to Reuters data, retail investor flows into US equities reached record levels in 2025, topping $308 billion. This represents a 14% increase over the “meme stock” craze seen in 2021, when flows of $270 billion were recorded.
Citadel confirms the continuation of this trend in its first-half 2026 report on market structure and flows, noting that during May and June it recorded an average daily cash equity trading volume 65% higher than in 2025, and more than double the 2024 average: “Nine of the ten highest-activity trading days ever recorded on our platform took place in the last two months, including seven in the month of June alone.” In fact, they point out that June 12 registered the largest single-day net volume of retail investor purchases ever observed on the platform, exceeding the previous record by 50%. It is worth noting that Citadel is the number one market maker for retail investors in the US, executing approximately 35% of all retail orders.
One of the keys to this spectacular increase in trading relates to expanded access for retail investors who did not previously invest in the market; according to Citadel, 50% of lower-income US households—traditionally the least active investing segment—today hold more than $615 billion in stocks and mutual funds, an all-time high. Since 2010, participation in stocks and mutual funds among the bottom 50% of US households by purchasing power has grown by more than 570%, outstripping any other income group.
In late 2020, video game retailer GameStop was one of the most heavily shorted stocks on the US market. Everything changed following a post on a Reddit forum by a user arguing that the company was undervalued. Soon, other forum users began investing in GameStop, driven partly by this user’s thesis—US investor Keith Gill, known on the forum as @RoaringKitty or @DeepFuckingValue—but also guided by a mix of emotions, ranging from nostalgia for bygone days to defying Wall Street elites.
GameStop became the first documented meme stock in history: users began buying shares en masse, eventually triggering a short squeeze (hedge funds that had taken short positions were forced to unwind them and buy back shares to cover losses, driving the stock price up and triggering further short covers). As a result, the stock rose from trading at $1.50 per share to hitting highs of $81.25 in a matter of weeks.
Five years later, the company continues to trade at nearly 15 times above its lows and recently submitted a takeover bid for eBay that was rejected by the company. According to SEC filings, GameStop holds a 10% stake in eBay, suggesting this chapter is not yet closed.
GameStop is not the only example, though it remains the most iconic instance of these sharp speculative movements centered on individual stocks that suddenly capture all the headlines for a brief period. This behavior has also been labeled “dumb money” by various media outlets. Another high-profile case, which resulted in a regulatory probe, involved Elon Musk’s tweets recommending investments in the cryptocurrency Dogecoin.
For Hartwig Kos, Head of Multi Asset Allocation at Allianz Global Investors, the recent IPO of SpaceX was the latest major meme. In an interview with Funds Society, Kos explained that his team has started working on identifying “meme themes”: “You position yourself from a fundamental standpoint, but you must also keep in mind what the trending topics are in the market, because the weight of the retail investor is very significant today. Currently, it is a market largely dominated by ‘animal spirits,'” he detailed.
Kos and his team also track whether retail investors buy during steep downturns, a behavior termed “buy the dip.” Citadel’s report confirms that retail investors purchased nearly 3.5 times the average daily volume on days when the S&P 500 closed lower during the first half of 2026.
For Fabiana Fedeli, CIO of Equities, Multi-Asset, and Sustainability at M&G Investments, one of the major shifts in equities since COVID has been the rise in dispersion across stocks, sectors, and countries. She cited as an example that in 2025, the materials sector “was fantastic in Asian emerging markets and very mediocre across the rest of the world.”
During a media presentation at the firm’s London office, Fedeli stated: “Investors are becoming increasingly specific and idiosyncratic,” while noting that retail investor participation in markets has virtually doubled since 2019 and that today’s retail investors are far better informed than in the past thanks to broader access to diverse information sources, including social media.
The expert defended M&G’s active management approach based on fundamental analysis, though without ignoring these trends: thus, if one of the stocks they hold or have on their radar becomes a meme stock, the protocol is to review the fundamental thesis: “If we believe it is truly worth buying, we wait for that ‘meme’ trend to cause its price to plunge, and then we enter; or, if we hold that stock and the ‘meme’ trend is pushing it to levels we believe completely overvalue future earnings, then we sell it.” Fedeli emphasized that the firm does not seek to actively participate, because “narratives change too quickly.”
At JSS SAM, manager Huseyin Turan notes that, in the case of mega-cap stocks, retail investor speculation “is not going to move share prices all that much.” Turan, who identifies as an X user (formerly Twitter) and a reader of several blogs, explains regarding comments from such accounts: “We have learned many good things from some Substack bloggers, but we are very selective. I don’t believe they have the capacity to move share prices, but they can move the narrative or the debate surrounding a stock.”
However, attributing stock market dynamics simply to the more or less irrational behavior of retail investors means taking the part for the whole. Citadel’s own report speaks of 2026 as witnessing “the structural transformation of equity markets” and draws conclusions regarding the primary forces currently moving markets: “Concentration, passive investing, retail investor participation, leverage, and volatility are no longer independent trends. Together, they increasingly determine how capital flows, how prices are set, and how risk is transferred.”
Among this set of interconnected trends, the growing role of passive management is worth highlighting. According to ETFGI data compiled in its Global ETFs Industry Landscape Insights report, the global ETF sector reached a record $23.09 trillion in the first half of the year, with net inflows hitting an all-time high of $1.33 trillion.
From M&G, Fabiana Fedeli warns that this changing dynamic is in turn altering how institutional investors allocate capital: “We have a number of clients who have asked us to start moving some money from passive to active management in areas where we believe we can generate greater returns actively.” The expert offered the example that year to date, returns for the Magnificent Seven have ranged between 6% and 7%, whereas investing in the 300 largest constituents of the S&P 500 “would have yielded more than double.” “Forget index investing. Real alpha can be achieved through stock picking,” she asserted flatly.
Fedeli added that more sophisticated asset owners are also shifting their asset allocation, moving from a strategic asset allocation to what she described as a “total portfolio allocation”: while a traditional strategic allocation involves a series of asset blocks assigned different static weights, allocations in this new model are far more dynamic and unanchored from indexes, instead establishing absolute return targets tailored to investor needs. “It is a harder way to invest, but many of us are adapting gradually. Today’s reality is that we have moved away from passive investing and there is greater capacity to be more granular,” she concluded.
“We are in a momentum market: the more something rises, the more it tends to rise afterward. These markets are very lucrative because they capture major long-term trends, especially when leverage is involved… and we are currently at peak leverage levels,” says Víctor de la Morena, CIO of Amundi Iberia, clarifying that he was referring primarily to institutional money.
During an outlook presentation for the second half of the year in Madrid, De la Morena explained that this combination of momentum and leverage is helping investors multiply their gains during uptrends, “but it generates tremendous volatility, because when those trends break, the pullbacks are brutal.”
De la Morena warns that investors seem already “accustomed to this type of market” where large swings can occur—in fact, unprecedented levels of volatility are being recorded in the Nasdaq—yet this combination of momentum and leverage is creating “a great deal of distortion.”
Kriti Gupta, Global Investment Strategist at J.P. Morgan Private Banking, and Nick Roberts, portfolio manager, point out the obvious: today it is AI capturing all the momentum. “Investors are not only buying shares in companies adopting this technology, but are also capitalizing on scarcities related to its development. This includes GPUs, memory, networking equipment, power generation, grid infrastructure, cooling, transformers, copper, gas turbines, and data center capacity. This trend has come at the expense of enterprise software and commercial services.”
Both experts note that the outperformance of this winning group has been historic so far this year, pointing out that internal dispersion within the momentum factor is at its highest level since 1990: “While a basket of large-cap US non-AI stocks is up 3.5% this year, a basket tied to AI data centers has generated a 47% return. The benchmark MSCI USA Momentum Index has risen 43% since the S&P 500’s trough on March 30, representing a rally more than double that of the broader index,” they note.
The latest test for this dynamic lies in the IPOs announced for this year. SpaceX’s successful debut has already brought an extra influx of demand, although De la Morena points out that “since the year 2000, no entity had demanded so much money from the market.” The expert stressed the need to monitor these “market tests” very closely to determine “to what extent that appetite reflects tangible investment rather than speculation.”
Regarding the IPOs announced for after the summer—Anthropic and OpenAI—De la Morena concludes with this warning: “What lies ahead could be an avalanche of capital, and that money has to come from somewhere: either it exits other assets, or it comes from liquidity and savings… or credit is extended to fund it.”
| By Beltrán | 0 Comentarios

State Street Corporation announced today that it has signed an initial agreement to acquire the Santander CACEIS Latam Securities Services joint venture in Brazil, Mexico, and Colombia. The joint entity, owned by Banco Santander and CACEIS, holds approximately $470 billion in assets under custody (AUC) and around $225 billion in assets under administration (AUA). The transaction will reinforce State Street’s presence in Latin America and establish the firm as a leading provider of custody, foreign exchange, and other middle- and back-office solutions across the region’s three largest institutional investment markets.
Combining State Street’s global platform with an established local market presence, regulatory expertise, end-to-end service capabilities, and top talent in Latin America will significantly expand the company’s global asset servicing network and strengthen its ability to support institutional investors in some of the world’s fastest-growing investment markets.
“Our success in servicing the world’s largest and most sophisticated global investors is built on our deep local presence and expertise around the globe. Effectively serving global and regional clients in Brazil, Mexico, and Colombia requires that same formula of local presence and specialized knowledge,” said Ron O’Hanley, Chairman and CEO of State Street. “This transaction will enable us to better serve our global clients with cross-border and local investment needs in Latin America, while also strengthening our ability to support investors in accessing growth opportunities and managing global portfolios to deliver better outcomes,” he added.
Following the closing of the transaction, State Street expects to retain the business’s experienced local teams and continue operating the entities through their existing market licenses and regulatory frameworks.
Joerg Ambrosius, President of Investment Services at State Street, stated: “Our clients are looking for an essential partner capable of delivering seamlessly across all markets.” He concluded: “By combining State Street’s global platform, which serves clients in more than 100 markets, with established local capabilities in Latin America, we are creating a stronger, more connected service model. This expanded model will help clients navigate complexity, manage risk, and pursue growth in the region with complete confidence.”
State Street intends to enter into definitive acquisition documentation following the completion of consultation processes with relevant employee representatives. The transaction is subject to regulatory approvals and other customary closing conditions, and is not expected to close until sometime in 2027.
Goldman Sachs & Co. LLC is acting as financial advisor to State Street on the transaction, while Freshfields is serving as legal counsel.
| By Amaya Uriarte | 0 Comentarios

The largest banking integration carried out since the 2008 financial crisis is entering its final stretch. However, beyond the operational success of the Credit Suisse absorption, UBS’s second-quarter results conveyed another, far-reaching message for the global financial industry: the wealth management business continues to consolidate its position as the single most critical source of growth for major international banks.
According to its financial report, during the second quarter of 2026, UBS reported net profit of $2.8 billion and pre-tax profit of $3.6 billion, while underlying profit rose to $3.9 billion—a 45% increase compared to the prior-year period. Revenues grew by 13%, driven by solid performance across virtually all divisions.
Nevertheless, the metric observed most closely by the wealth management industry was altogether different. The Global Wealth Management division successfully attracted $36 billion in net new assets during the quarter, bringing the total to $73 billion for the first half of the year—a clear signal that the firm continues to capture wealth from high-net-worth clients even after integrating the vast majority of Credit Suisse’s legacy business.
As a result, total invested assets managed across the entire group reached a record high of $7.3 trillion, a figure that cements UBS’s position among the largest wealth managers globally.
During the earnings call, executive management highlighted that growth was particularly robust in the Americas and Asia—regions where the high-net-worth population continues to expand and where demand for specialized financial advice maintains a structural upward trajectory.
In this context, client transaction revenues within the wealth management unit grew 23% year-over-year, reflecting heightened investment activity propelled by more dynamic financial markets and a renewed risk appetite throughout much of the quarter.
The combination of new inflows, higher advisory fees, and a favorable investment environment reinforces a trend recently mirrored by other financial titans such as BlackRock, Vanguard, Morgan Stanley, and JPMorgan: competition no longer centers merely on selling financial products, but on managing long-term relationships with increasingly wealthy and sophisticated clients.
Just three years ago, UBS faced the formidable challenge of absorbing Credit Suisse following the latter’s collapse. Today, that process is virtually ceasing to be a source of uncertainty. The institution reported that over 90% of legacy technology applications have been decommissioned and nearly 70% completely decommissioned, while cumulative synergies have reached $12 billion in gross cost savings—nearing the target of $13.5 billion slated for year-end.
For investors, this signals that the bank can once again pivot toward growth rather than integration. The results also underscore how the business model of major international banks has evolved. While traditional lending activities face compressed margins and heightened regulatory burdens, wealth management offers recurring revenues, lower capital requirements, and client relationships that frequently span decades.
In UBS’s case, Global Wealth Management generated revenues of $7.1 billion—approximately half of the group’s total top-line revenue—consolidating its role as the bank’s primary growth engine.
Furthermore, this financial strength enabled UBS to announce a new $3 billion share buyback program, of which at least $1 billion is slated for execution over the coming months—though the pace of execution will also depend on forthcoming capital rules being discussed by Swiss regulators in the wake of Credit Suisse’s collapse.
For the global wealth management industry, UBS’s results yield an important conclusion. The Credit Suisse integration is fading as the central talking point. In its place emerges a structural reality: wealth creation continues to expand, high-net-worth individuals remain in pursuit of specialized advice, and institutions with global scale are the primary beneficiaries of this shift.
If a decade ago the race was to become the largest bank, today the competition appears concentrated on managing the largest possible pool of private wealth. And, for now, UBS is demonstrating that this strategy continues to pay off.
| By Amaya Uriarte | 0 Comentarios
Janus Henderson has entered into a strategic partnership with Insignia Financial Ltd (Insignia), one of Australia’s leading wealth management providers. The transaction includes the acquisition of three specialized investment managers: Antares Fixed Income, Antares Equities, and Fairview Equity Partners.
The three firms manage approximately AUD 33 billion in Australian fixed income, large-cap equities, and small-cap equities, “significantly reinforcing Janus Henderson’s commitment to Australia and expanding its local investment capabilities,” according to the asset manager. Furthermore, the client base is predominantly institutional—encompassing both Insignia mandates and third-party institutional clients—while also featuring a range of well-established retail investment strategies.
Upon completion of the transaction, Antares Fixed Income will integrate into Janus Henderson’s existing Australian fixed income team, creating one of the largest dedicated fixed income offerings in the local market. Antares Equities will join Janus Henderson’s global equity business, continuing to offer Australian large-cap equities to institutional and retail clients.
Meanwhile, Fairview Equity Partners—in which Janus Henderson will acquire Insignia’s 40% stake—will continue to operate independently as a specialized boutique manager focused on Australian small-cap equities.
The transaction reinforces a long-term strategic partnership between Janus Henderson and Insignia, through which Janus Henderson will provide a broad suite of its global investment capabilities to Insignia’s investment solutions. The alliance supports Insignia’s objective of delivering scalable, cost-effective investment solutions for its members and clients, while providing both firms with a foundation for long-term growth.
According to the asset manager, the transaction aligns with Janus Henderson’s overarching strategy to partner with major institutional clients and scale its existing capabilities in high-demand areas. Additionally, it advances its strategic priorities by consolidating its core business in Australia and diversifying its capabilities through the addition of investment teams with established track records.
“We are excited to announce this partnership with Insignia, which significantly strengthens our presence in Australia and reflects our long-term commitment to a market of strategic importance for the firm. By combining the acquisition of established investment teams with a long-term partnership, we deepen our relationship with a leading wealth manager and expand the capabilities we offer to our clients,” said Ali Dibadj, Chief Executive Officer (CEO) of Janus Henderson.
Garry Mulcahy, CEO of Asset Management at Insignia Financial, added: “We are delighted to enhance our strategic partnership with Janus Henderson. Combining Janus Henderson’s global investment capabilities with the expertise of the Antares and Fairview teams establishes a strong foundation for future growth in the Australian market. We have a long-standing relationship with Janus Henderson and look forward to continuing our work with such a high-caliber global investment firm.”
The financial terms of the transaction were not disclosed. Closing is expected to occur in the fourth quarter of 2026, subject to customary closing conditions, including regulatory approval.
| By Amaya Uriarte | 0 Comentarios

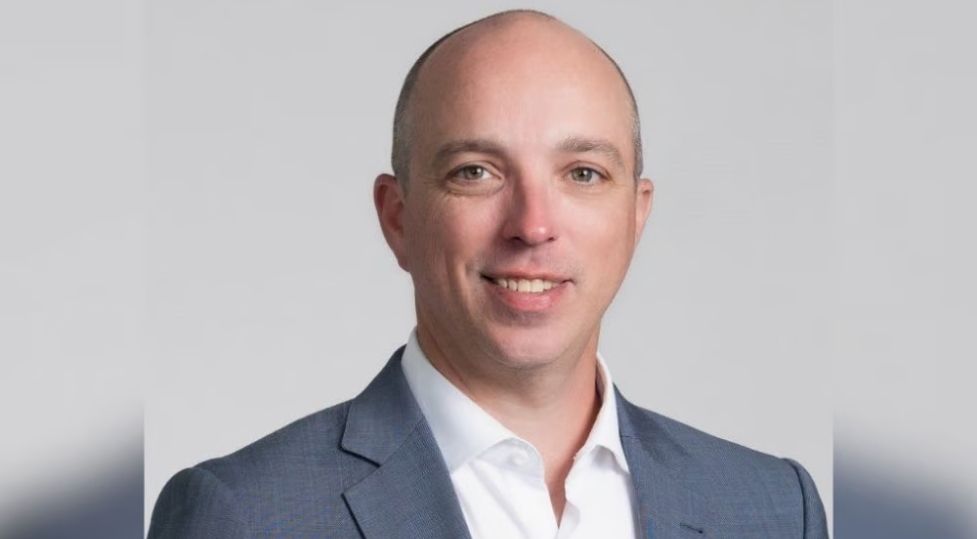
Lazard Asset Management (LAM) has reinforced its senior leadership team with the appointments of Chris Bricker as Head of Corporate Development and Theodore P. Enders as Head of Product, as part of its strategic growth initiative. According to the firm, both appointments reflect LAM’s commitment to expanding its investment and solutions capabilities to meet evolving client needs and build the foundation for the firm’s next growth phase, while remaining true to its long-standing active management focus.
“These appointments bring together two complementary capabilities at a pivotal moment in LAM’s evolution. Chris and TP are highly regarded industry veterans. Chris brings more than three decades of experience with a sharp focus on identifying, structuring, and integrating strategic opportunities. TP has spent his career building premier product strategies through a rigorous, client-centric lens that aligns investment capabilities, client requirements, and business priorities. Together, they will help us make disciplined decisions on where we invest, how we scale, and how we deliver differentiated solutions to clients worldwide. I am delighted to welcome them to Lazard,” said Chris Hogbin, CEO of Lazard Asset Management.
Bricker will lead corporate development and LAM’s strategic growth agenda. His focus will center on opportunities that leverage the firm’s core strengths as an asset manager, enhance its client value proposition, and expand its footprint in priority areas. He will report directly to Chris Hogbin, Chief Executive Officer of Lazard Asset Management.
Bricker joins from AllianceBernstein, where he spent over three decades and most recently served as Head of Corporate Development and as a member of the Operating Committee. Throughout his tenure, he led a wide array of transactions and strategic partnerships while driving one of the firm’s largest product expansions. Previously, he oversaw AllianceBernstein’s publicly traded alternative assets business and led both product strategy and M&A.
“Opportunities to help shape how a firm of this caliber scales—rather than simply expanding existing operations—are rare. Lazard Asset Management has both the ambition and the platform required to grow and better serve its clients. That prospective outlook is what drew me here, and I look forward to working alongside Chris Hogbin and the broader Lazard team to future-proof the business,” stated Chris Bricker, incoming Head of Corporate Development.
For his part, Enders will lead LAM’s global product strategy, overseeing the development of the firm’s platform across investment strategies, vehicles, client channels, and geographic markets. Working in close collaboration with investment, distribution, and regional leadership teams, he will prioritize the capabilities and solutions best positioned to differentiate LAM and drive growth. His mandate is to enhance Lazard’s ability to translate its investment expertise into concrete, scalable, and client-relevant solutions. He will report to Rosalie Berman, Chief Operating Officer of Lazard Asset Management.
Enders joins from Goldman Sachs, where he served for over two decades as a Managing Director at Goldman Sachs Asset Management. He most recently served as CIO and previously held the role of Global Head of Product Development, managing an international team. In that capacity, he led the integration of a key European acquisition, supervised the firm’s first mutual-fund-to-ETF conversion, and launched a suite of option-based income ETFs.
Enders added: “Having spent more than two decades in the industry, I have always admired Lazard as one of the most respected houses in active management, boasting a legacy and client base that few can match. The vision and ambition the firm has outlined for the coming years are compelling, and I am excited to help shape the product strategy with the rigor and discipline that this vision demands.”
Bricker and Enders will jointly work to translate LAM’s strategic priorities into a defined, client-centric agenda designed to drive profitable growth. Their efforts will underpin the firm’s evolution: identifying where it can best serve clients and determining how to efficiently deliver new capabilities to market under the Lazard 2030 strategic plan.
| By Beltrán | 0 Comentarios

Andersen Iberia has launched the Miami Hub, a strategic base through which the firm will coordinate advice for Latin American, Spanish, and international clients—including high-net-worth individuals, family businesses, investors, and corporations—with business interests spanning Spain, Latin America, the United States, and other markets.
With this initiative, Andersen Iberia reinforces its positioning as a strategic partner for clients operating internationally, drawing on its experience in cross-border transactions and the coordination of specialized teams in tax, wealth planning, real estate investment, family enterprise, and business law.
José Vicente Morote, Managing Partner of Andersen Iberia, emphasized that this opening comes in response to growing demand from the firm’s clients: “An increasing number of companies and high-net-worth individuals are asking us for advice that isn’t limited to a single jurisdiction, but rather understands their operations, tax position, and legal risks across different countries from a global perspective. With the Miami Hub, we respond to that need by offering a physical and operational benchmark that strengthens our value proposition as an integrated firm.”
The Miami Hub is led by Jorge Martínez Alemán, Counsel at Andersen, who brings a solid track record in tax and wealth advisory for family businesses and high-net-worth individuals. Holding a degree in Business Administration and Management from the University of Valencia, he completed his training with a Master’s in Taxation and a Master’s in International Taxation at the CEF (Center for Financial Studies). Beyond his specialization in international tax law, he holds extensive experience in real estate transactions in Spain and tax planning for athletes. Ranked by the Chambers High Net Worth guide for 2023, 2024, and 2025, he is an active member of the Spain-United States Chamber of Commerce in Miami, Florida.
Andersen’s Miami Hub provides companies, investors, and family offices with interests in Europe, Latin America, and the United States with coordinated advisory services that combine business vision, technical expertise, and international reach.
As highlighted by the firm, when a matter requires it, the Miami Hub will work in close coordination with local teams and advisors, thereby ensuring a tailored response to the specific needs of each transaction and jurisdiction. To achieve this, it relies on the backing of Andersen Iberia’s teams in Spain and Portugal, allowing it to offer deep knowledge of the legal, regulatory, and tax frameworks applicable to transatlantic operations.
Added to this is the know-how of Andersen Global, which boasts a presence in 185 countries and over 50,000 professionals worldwide. Specifically, in Latin America, the firm operates in 18 countries, while in the U.S. it has 30 offices and 2,500 professionals.
In this way, the Miami Hub supports clients in structuring and executing cross-border investments, corporate transactions, and wealth management projects—helping identify opportunities, anticipate risks, and provide the legal certainty required for decision-making in an increasingly complex global environment.
| By Beltrán | 0 Comentarios
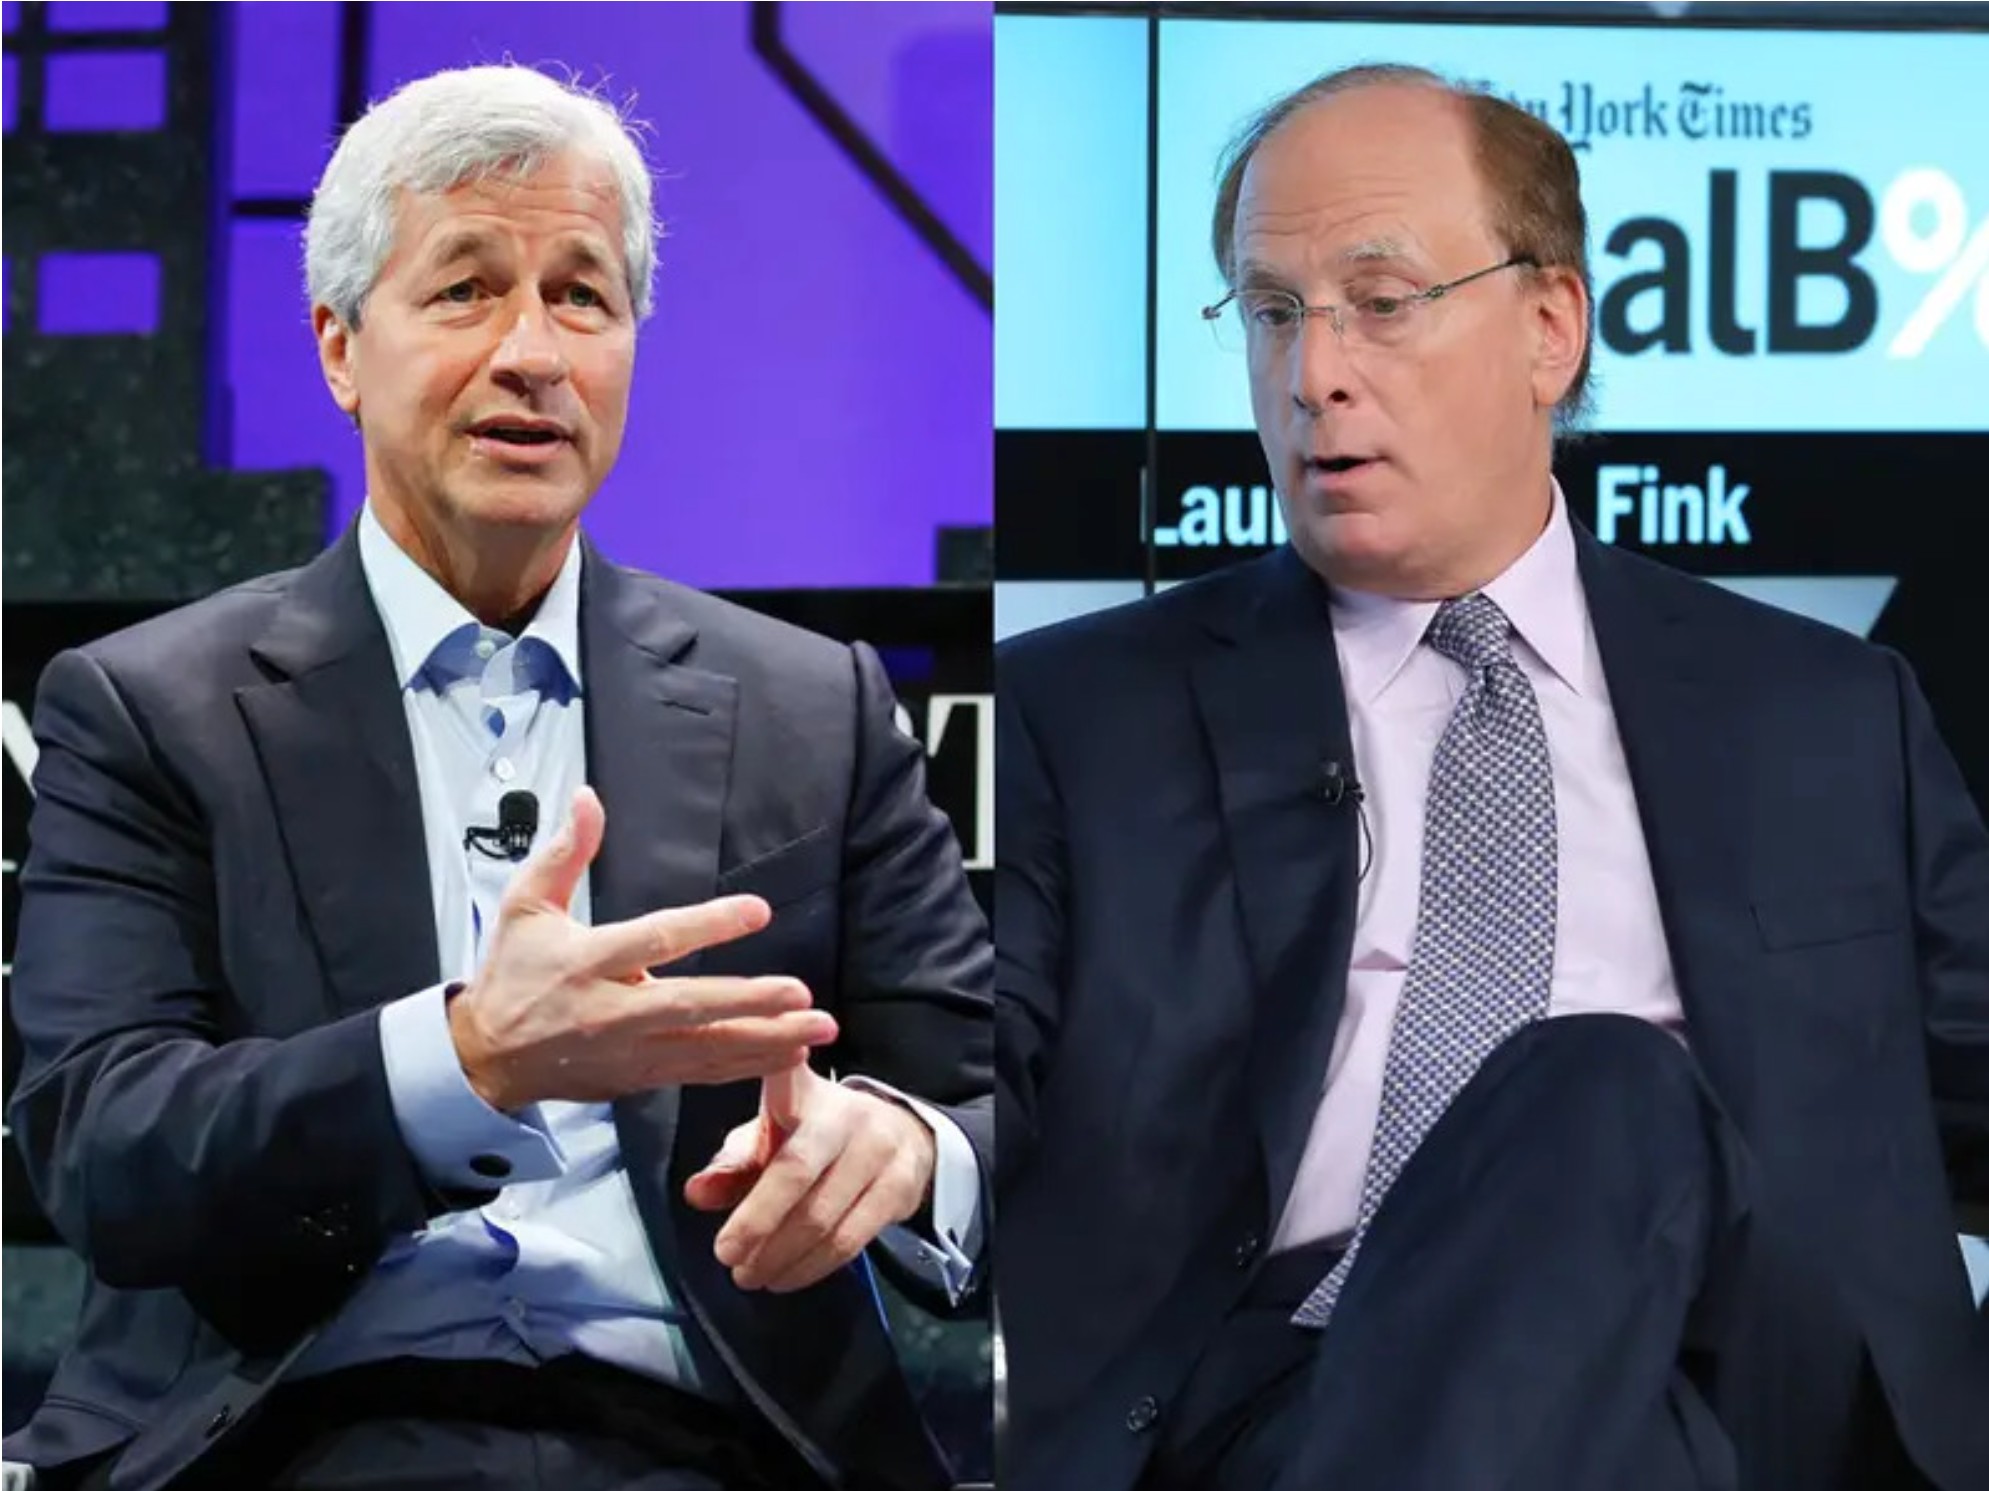
The most recent letters from Larry Fink, Chairman and CEO of BlackRock, and Jamie Dimon, Chairman and CEO of JPMorgan Chase, to their respective boards of directors share a distinction not seen in previous years; both reveal two different strategies, but an underlying point of agreement: the old investment roadmap is no longer sufficient to explain where growth will come from in the years ahead. This marks a major transformation of the investment ecosystem for the coming decades. Fink writes from the perspective of the world’s largest asset manager, proposing that the future of investing lies in connecting public and private markets, technology, infrastructure, artificial intelligence, and a much broader participation of retail savers. Dimon, for his part, writes from the largest U.S. bank, yet with a vision that also points toward integrating banking, wealth management, private markets, ETFs, digital assets, and AI.
They are not proposing the exact same thing. However, both are arriving at a similar conclusion: the investment of the future will not be organized around a single asset class, but around an ecosystem. And the numbers show this is not just rhetoric. BlackRock ended June with a record $15.3 trillion in assets under management (AUM) after attracting $321 billion in net inflows during the first half of 2026, $192 billion of which arrived in the second quarter. Flows were broad-based, originating from ETFs, private markets, active fixed income, and systematic equity strategies. In parallel, revenue from technology services and subscriptions grew 13% year-over-year, driven by Aladdin and multi-product solutions.
JPMorgan Asset & Wealth Management is not far behind. It closed 2025 with $7.1 trillion in client assets, up from $5.9 trillion reported a year earlier. Its alternative assets reached $560 billion, up from $504 billion in 2024 and just $221 billion in 2015. Furthermore, the division logged $553 billion in client asset flows in 2025—a record crowned by its 22nd consecutive year of positive net inflows. The scale of both businesses helps illustrate the magnitude of the shift underway.
Larry Fink’s 2026 letter, titled Growing with Your Country: Thoughts from a Long-Term Optimist, stems from a concern that might seem distant from portfolio management: the world is moving away from the globalization model that dominated past decades. Europe is raising defense spending, the United States is seeking to rebuild industrial capacity, and emerging markets are developing domestic energy sources. At the same time, artificial intelligence is driving the need to construct data centers, power grids, semiconductors, and new computing capabilities. Fink’s central point is that this transformation requires vast amounts of capital. In his view, banks and governments can no longer fund the investments needed by the new economy on their own. Capital markets will have to assume an increasingly larger share of that burden.
Here lies a fundamental shift in BlackRock’s vision. For decades, the firm’s growth was primarily associated with institutional fixed income, index funds, and later, iShares ETFs. Now, Fink is describing a significantly broader enterprise: a platform intent on operating across equities, fixed income, ETFs, private markets, infrastructure, private credit, digital assets, technology, and data. This evolution is reflected even in the structure of its acquisitions. BlackRock closed deals for HPS Investment Partners, Preqin, and ElmTree in 2025, following its 2024 acquisition of Global Infrastructure Partners (GIP). The result is a platform that bridges public markets, private markets, and technology.
And the target is quantified: BlackRock aims to achieve $400 billion in cumulative net organic fundraising in private markets by 2030. Its infrastructure platform already features GIP’s flagship fund, which raised $25.2 billion, while private credit recorded nearly $20 billion in net inflows in 2025. It is no coincidence that Fink places private markets at the core of this transformation. BlackRock already manages $3 trillion for insurance, wealth management, and outsourcing clients, holds roughly $700 billion in general account assets for insurers, and has over $30 billion in retail private market assets. The strategy is to expand these investments into client segments that long remained concentrated almost exclusively in traditional stocks, bonds, and funds.
This move is particularly significant because it means the line between public and private markets is beginning to blur within portfolio construction. BlackRock explicitly acknowledges this in its 2026 private markets outlook: investors are increasingly combining public and private assets to gain exposure to artificial intelligence, infrastructure, and other major structural themes, as private markets evolve into an ecosystem more integrated with public markets. However, the transformation Fink envisions does not stop at private assets; his letter introduces a second revolution: the digitization of financial ownership.
The BlackRock CEO suggests that with tokenization, a single digital wallet could eventually hold ETFs, tokenized bonds, digital currencies, and fractional stakes in assets historically out of reach for retail investors, including infrastructure projects and private credit funds. In other words, it is not just what people invest in that is changing, but also the infrastructure through which investments are bought, held, and traded. This is an important distinction. While ETFs democratized access to diversified portfolios, the next phase envisioned by BlackRock could democratize access to assets that previously required large minimum investments, sophisticated structures, and institutional relationships.
And that is where Aladdin comes in. BlackRock’s technology platform is no longer just an internal risk management tool. Technology and subscription revenues grew 13% in the second quarter of 2026 as the company continues to position Aladdin as a core piece of its multi-product offering. BlackRock is thus attempting to simultaneously become an asset manager, a private investment originator, a distributor, a technology provider, and an operator of financial infrastructure.
Jamie Dimon arrives at a similar conclusion from a different starting point. In his shareholder letter, published on April 6, 2026, the CEO of JPMorgan Chase acknowledges that competition no longer comes solely from other banks; it also comes from asset managers, fintechs, digital platforms, blockchain, stablecoins, and other forms of tokenization. JPMorgan’s response, Dimon notes, is to invest and move quickly, embedding artificial intelligence into virtually everything it does. His description of JPMorgan is revealing: an institution that must continue enabling clients to store money, move money, invest it, raise capital, and manage investments—but through technologies and products that are altering how those activities are performed.
In 2025, JPMorgan generated record revenues of $185.6 billion, net income of $57 billion, and a return on tangible common equity (ROTCE) of 20%. Yet perhaps more telling for its strategy is that during that year, the bank extended credit and raised capital totaling $3.3 trillion for clients, moved nearly $12 trillion daily across more than 120 currencies and 160 countries, and held over $41 trillion in assets under custody. In short, JPMorgan is not attempting to adapt to the new economy merely as a portfolio manager. It is seeking to control much of the various plumbing through which capital flows. On the subject of AI, Fink and Dimon converge once again. For both, artificial intelligence is far more than an opportunity to buy tech stocks.
Fink contends that AI is reshaping the very nature of investing. The combination of large datasets, systematic models, machine learning, and human oversight is driving a management model capable of analyzing thousands of securities simultaneously and with discipline. BlackRock has spent four decades building data and tech capabilities for this purpose. Dimon is even more direct. In his letter, he asserts that AI will affect virtually every function, application, and process at JPMorgan, and that its adoption could unfold much faster than previous technological shifts. Furthermore, the bank is spending heavily to build this infrastructure. JPMorgan has slated a technology budget of approximately $19.8 billion for 2026. Its Asset & Wealth Management division utilizes tools like SpectrumIQ to integrate research, data, and risk across some 90,000 securities and 22 million documents, cutting the time between manual research and actionable insights by 80%.
The transformation also reaches advisory services. Connect Coach uses 25 specialized AI agents to deliver personalized ideas to JPMorgan advisors and has generated one million customized insights for roughly 5,000 users across the Global Private Bank. Thus, artificial intelligence is beginning to serve a dual purpose: it helps identify investments while simultaneously changing how they are distributed and advised upon. JPMorgan’s strategy in private markets is especially significant because it demonstrates that this shift is not confined to BlackRock. Dimon notes in his letter that JPMorgan is expanding its private market capabilities, while Asset & Wealth Management increases its exposure to alternatives and ETFs.
The $560 billion figure in alternative assets at JPMorgan AWM by year-end 2025 represents an increase of roughly $339 billion compared to 2015—more than triple the level of a decade ago.
Yet JPMorgan is not abandoning traditional active management; it is modernizing it. The firm reported that 83% of its long-term active fund assets outperformed their peer median over the ten-year period ending in 2025. At the same time, it turned active ETFs into one of its main growth engines: ending 2025 with $250 billion in active ETF assets and $65 billion in flows, ranking first in the industry in both metrics, according to the company. The firm expects the active ETF market to grow from roughly $2 trillion in 2025 to over $6 trillion by 2030. This creates an interesting paradox: the new architecture does not eliminate traditional instruments; it integrates them. The ETF does not vanish before the private market; active management does not disappear before AI; and the financial advisor does not fade away before automation. All become building blocks of a more complex portfolio.
The perspective of Sergio Méndez, Country Head of BlackRock Mexico, is particularly helpful for understanding this transformation from a Latin American standpoint. During the presentation of the Investment Outlook for the Second Half of 2026, Méndez noted that “technological change is paramount” and that AI is shaping markets. However, his argument goes beyond simply betting on tech companies. In a conversation with Funds Society, Méndez explained that AI requires building an entire scaffold of infrastructure, energy, capital, and talent to make its growth sustainable. Here lies one of the most relevant ideas for understanding where asset management is heading.
Méndez argued that it is no longer enough to speak about specific assets or companies, but rather about a “total portfolio,” where commodities and metals earn a place alongside fixed income and equities. The phrasing is telling because it aligns with the paradigm shift visible—albeit from different angles—in both Fink and Dimon: first identify the major themes and risks of the new economic regime; then build the portfolio; and finally decide which financial vehicle to use. In Mexico, this vision takes on an added dimension. Méndez noted that BlackRock sees opportunities in technology, energy, and logistics—including rail and ports—and that the expansion of AI will surge the demand for infrastructure capable of supporting tech growth.
This is no minor coincidence. The investment thesis ceases to be simply “buy tech” and becomes far broader: invest in everything that enables technology to exist and scale. That includes data centers, power generation, grids, digital infrastructure, minerals, logistics, semiconductors, credit, and private equity. In that context, Mexico fits into a larger global trend: the nearshoring of supply chains and the need for infrastructure investment to sustain an increasingly digitized economy.
The most significant consequence of these shifts may well be seen in portfolio construction. The traditional model based on stocks and bonds is not disappearing, but it is ceasing to be sufficient as a representation of the full opportunity set. BlackRock is proposing a framework bridging public and private markets. JPMorgan is blending active ETFs, fundamental management, alternatives, private banking, and customized solutions. Meanwhile, the market is introducing structures capable of delivering these investments to clients who previously lacked access.
At BlackRock, for example, the firm launched a portfolio solution alongside Partners Group that integrates private equity, private credit, and real assets within a single vehicle for wealth management clients. JPMorgan is pursuing a similar goal from another angle. Its Separately Managed Account (SMA) infrastructure, combined with tools like 55ip and OpenInvest, enables tax transitions, systematic tax-loss harvesting, and the construction of portfolios aligned with individual preferences. By year-end 2025, it managed $434 billion for SMA investors across roughly double the accounts it had in 2021; customization thus becomes another core pillar of the new architecture. It is not just about offering more assets—it is about assembling them differently for every client.
However, this transformation is not strictly a story of opportunity. Dimon himself introduces a particularly relevant warning regarding the growth of private credit. In his letter, he estimates the leveraged private credit market at approximately $1.8 trillion, compared to $1.5 trillion for the U.S. high-yield market and $1.7 trillion for the syndicated leveraged loan market. His warning is clear: when the next credit cycle arrives, losses could be higher than expected, and not all market participants possess equal capacity to originate and manage credit. He also cautions that products sold to retail investors require greater transparency, higher standards, and fewer conflicts of interest.
This is likely the primary tension of the new model. Major managers want to broaden access to private markets, but the closer those assets get to retail investors and retirement savings, the higher the demands for liquidity, transparency, valuation standards, governance, and investor protection. Fink acknowledges this from another angle when discussing tokenization: financial modernization requires clear rules, buyer protection, counterparty risk standards, and digital identity framework. Financial democratization, therefore, does not simply mean allowing more people to buy more assets. It means building an infrastructure capable of doing so without shifting risks previously confined to sophisticated institutions onto retail investors.
A comparison between Fink and Dimon leads to an intriguing conclusion. BlackRock is striving to become a platform connecting public markets, private markets, technology, data, and distribution. JPMorgan is striving to become a comprehensive financial platform where banking, investing, payments, private markets, ETFs, wealth management, and artificial intelligence operate as interconnected components of a single system. One originates from asset management; the other from banking. Yet both are moving toward the exact same destination.
The next decade of investing may be less defined by the question of “stocks or bonds?” and much more by questions like: What infrastructure does AI require? Who will fund the energy transition?Where will private capital reside? Which economies hold critical resources? Which markets will benefit from geopolitical fragmentation?How will public and private assets be combined? How much of a portfolio can be automated? How will risk be personalized? And how can an everyday saver access opportunities historically reserved for institutions? The answer being built by Fink and Dimon suggests that the individual asset will cease to be the center of the conversation, replaced by the total portfolio—backed by technology and designed around major structural forces.
This does not mean ETFs, equities, or bonds have lost their relevance. In fact, flow data from both institutions in these assets demonstrates the opposite. It means they will now have to coexist with private credit, infrastructure, real assets, alternatives, digital assets, systematic strategies, and new forms of advisory—in other words, a “total portfolio,” as defined by Sergio Méndez, head of BlackRock Mexico. The deepest transformation, then, lies not in any single product, but in the overall architecture. Both institutions are betting that the asset manager of the future will not simply be the one
| By Amaya Uriarte | 0 Comentarios
Plain-vanilla, low-cost ETFs and active ETFs can play complementary roles in portfolios to maximize returns. That is the view of Matthew Bartolini, Global Head of Research Strategists at State Street Investment Management, who analyzes the latest investment flows into exchange-traded funds in an interview with Funds Society. Bartolini believes that long-term demand for core ETFs is widespread, adding that looking ahead, “any further fee reductions will likely depend on scale, operational efficiency, and asset growth.”
In the first half of 2026, inflows into ETFs exceeded $1 trillion, putting annual inflows on track to top $2 trillion. During this period, one out of every two dollars invested in ETFs (49%) went to low-cost ETFs—the category of funds upon which the ETF industry was built.
Investment inflows into low-cost ETFs remain exceptionally solid despite the surge in actively managed ETFs. What is driving this continued interest in these products?
Core low-cost ETFs remain foundational building blocks in portfolio construction for investors. They offer transparent, diversified exposure to key asset classes and market segments at a very low cost, making them effective strategic allocations within portfolios.
Their combination of broad market exposure, operational simplicity, and cost efficiency continues to resonate across a wide range of investors. These attributes also contributed to the State Street S&P 500 SPDR Portfolio ETF (SPYM) being selected as a default investment option within the new “Trump Accounts” program, expanding ETF adoption to a new generation of investors.
It is worth noting that this long-term demand is widespread. Advisors, institutions, model portfolio providers, and retirement-focused investors are increasingly turning to low-cost ETFs as efficient tools for portfolio construction, implementation, and long-term wealth accumulation.
How are low-cost ETF providers adapting their product lineups to this environment marked by the boom in active management?
The surge in active ETFs has not diminished demand for low-cost, plain-vanilla ETFs. Investors increasingly view them as complementary tools: low-cost ETFs provide efficient market exposure as the core of the portfolio, while active ETFs are used to pursue specific objectives, such as income generation, risk management, or alpha generation.
Regarding our solutions within our ETF lineup, the goal is to ensure we have a robust platform that includes both low-cost and active exchange-traded funds, enabling complementary uses. And that aligns with how investors construct their portfolios.
For instance, a typical portfolio might use broad-market, low-cost equity and fixed income ETFs as a foundation, then overlay active strategies to generate income, manage risk, seek alpha opportunities in less efficient markets, or execute a specific, granular thematic investment thesis.
The reality is that investors are increasingly adopting both active ETFs and low-cost index-based ETFs, deploying each for the function it performs best within the portfolio. In some cases, we see low-cost index exposures being used actively to build more customized allocations that align with a portfolio’s risk tolerance or a broad macroeconomic outlook.
This is most prevalent in fixed income, where strategies exist that break down overall macroeconomic betas into different maturities within U.S. Treasury or U.S. corporate bond markets to balance yield and duration profiles with greater precision.
Is there scope in the industry to continue reducing ETF fees?
Many core beta exposures are already priced exceptionally low, although the industry continues to see periodic fee reductions. Looking ahead, any further fee reductions will likely depend on scale, operational efficiency, and asset growth.
Which types of low-cost ETFs are currently generating the greatest interest among investors?
Broad equity exposures have captured the lion’s share of low-cost flows year-to-date. Seventy percent of low-cost flows in 2026 have gone toward equity exposures (+$381 billion), with 70% of that total (+$291 billion) funneled into low-cost ETFs focused on U.S. equity markets.
This trend reflects the efficiency of broader equity markets and investors’ ongoing desire to access core market beta at a low cost. It also helps explain why active managers tend to focus on areas where they believe there are greater opportunities to generate alpha—for example, ex-U.S. markets.
The picture is somewhat different in fixed income. Active fixed income ETFs have captured a larger share of flows than would be expected based on their market share of assets under management, with active fixed income attracting approximately 42% of flows versus 31% of assets.
The opposite is true for low-cost fixed income ETFs, which account for 57% of flows despite comprising 69% of fixed income ETF assets. This suggests that investors are increasingly turning to active managers to help enhance yield opportunities while managing interest rate, credit, and macroeconomic uncertainty across bond markets.