The Gulf States’ rising trade and investment links with emerging Asian markets increase their economic dependence on global growth and exposure to foreign shocks, say Standard & Poor’s economists in a report published today “Gulf States Are Increasingly Vulnerable To An Emerging Market Slowdown.”
Trade relations between the Gulf Cooperation Council (GCC) countries and Asia (excluding Japan) have grown substantially at the expense of Europe, the U.S., and Japan since 2005. This is mainly because emerging Asian countries’ demand for hydrocarbon commodities, the Gulf states’ main export, is rising. Meanwhile, growing unconventional energy production and energy efficiency in developed markets are reducing their import needs.
“GCC exports of goods to the EU, the U.S., and Japan fell to less than 30% in 2012 from 51% in 1995. Meanwhile, Asia is now the GCC’s largest export destination, accounting for 57% of total foreign sales,” said Standard & Poor’s economist Sophie Tahiri.
Despite these growing trade ties, the Gulf States have been largely unaffected by the recent capital outflows and declining asset values that emerging markets have experienced since the U.S. Federal Reserve signaled it would start tapering. One reason for this is that GCC countries’ fiscal and trade surpluses make then largely immune to foreign capital outflows.
“Nevertheless, Gulf States would be vulnerable to a potential slowdown of growth in emerging markets, the report says. “A sharp slowdown in major emerging economies and an intensification of capital outflows, although not our baseline scenario, would affect GCC countries mainly through falling oil market prices,” said Ms. Tahiri.
We nevertheless expect that GCC states would implement fiscal expansion to support the national economy in a scenario of falling oil prices. However, Bahrain would be the most vulnerable Gulf country in such a scenario because it’s the only country already running a fiscal deficit, the report concludes.
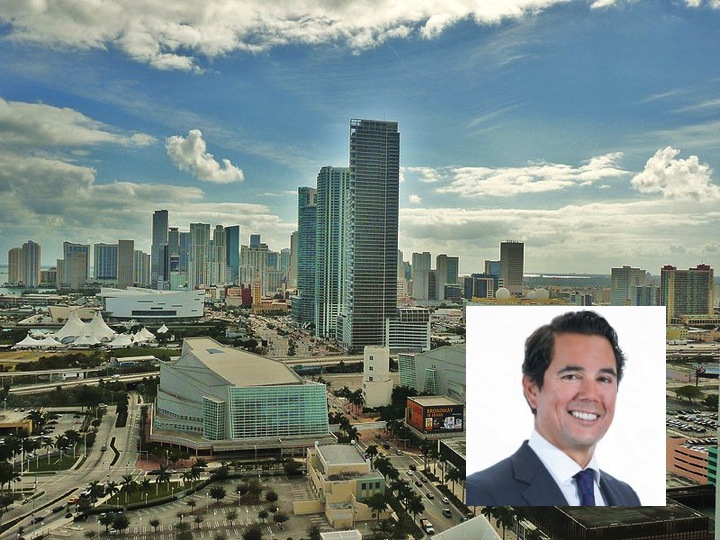
Photo Miami: Marc Averette. Boris Espinoza on the right (Linkedin). Boris Espinoza Joins Citi Private Bank's Miami Office
Citi Private Bank announced today that Boris Espinoza has joined the firm’s Miami office as a Director and UHNW Private Banker, reporting to Luke Palacio, Southeast Regional Market Manager.
“As we continue our expansion in the South Florida region, we are delighted to welcome Boris to the team to help us reach more clients and deliver seamless service to the many multi-jurisdictional families who live here. With more locations in more cities around the world, we are the best positioned firm in this market to do so,” said Palacio.
Mr. Espinoza joins from JP Morgan where he was a Director and Private Banker. Prior to joining JP Morgan in 2010, Mr. Espinoza spent 12 years at ABN AMRO working in Sao Paulo, Buenos Aires, Miami and New York. While there, he held various roles in the Investment Banking division, most recently as a Director in the firm’s Debt Capital Markets group in New York.
Mr. Espinoza holds a B.S. from Stony Brook University and a MBA from the University of Miami.
“Citi Private Bank is a recognized leader in this market for providing sophisticated wealth management and investment advice for the ultra-high net worth segment. I look forward to leveraging the full capabilities of the Citi platform on behalf of our clients by providing access to capital, compelling investment opportunities, cross-border wealth planning and by collaborating with Citi’s investment banking team.”
The international investment manager Threadneedle Investments announces that it has entered into a promotion and referral agreement with South African investment manager STANLIB to introduce its clients globally to STANLIB Africa strategies. STANLIB will similarly offer African investors access to Threadneedle capabilities. STANLIB, which manages over US$45 billion for retail and institutional clients, specialises in South African and African investments across all major asset classes including property.
The agreement follows the announcement in August 2012, that STANLIB had selected Threadneedle to manage in excess of US$800 million in Global and Emerging Market equity and Global Balanced portfolios as part of its offshore investment range. Today, Threadneedle manages in excess of US$1 billion on behalf of STANLIB.
Strategies that Threadneedle will introduce include: Africa ex South Africa Equity, a strategy asset management footprint in Africa, Global Emerging Market Property and Direct Property investment opportunities in carefully chosen economically growing areas on the African continent managed by STANLIB. STANLIB will actively promote Threadneedle investment capabilities to African investors.
Michael Housden, Head of Middle East and Africa Distribution at Threadneedle comments: “We are delighted to be able to offer investors across the globe access to African strategies which invest in some of the fastest growing and still largely untapped markets in the world. We expect to see increasing demand from investors for exposure to Africa given the tremendous growth opportunities the continent offers. Equally we believe investors in Africa will be attracted to Threadneedle excellent track record of outperformance across asset classes”.
Dylan Evans, Head of International Business Development at STANLIB: “Economy is around $2.0 trillion and is expected to reach $2.6 trillion by 2020. Yet, very few of the largest 200 pension funds in the UK and Europe are known to have any dedicated exposure to Africa. Of course, Africa is not without its risks and high among these is political risk. Evidence of that was clearly apparent in North Africa in 2013, where political unrest led to volatile performances from both Egypt and Tunisia. However, a well-diversified African portfolio can be profitable for investors even when individual markets are under pressure, different African markets being driven by different dynamics”.
The outlook for 2014 is promising, with grow by around 5.5% in 2014, the average rate over the past decade faster than any other region in the world, according to the Economist Intelligence Unit2. An investment in Africa is certainly likely to be more volatile than in other markets, “but we believe Africa’s superior growth prospects and under- representation in investors’ portfolios create many opportunities for long-term investors”.
Banco Central Europeo. Foto: Jurjen_ni, Flickr, Creative Commons.. Los bancos europeos: en marcha hacia la rentabilidad
ING Investment Management (ING IM) maintains its positive outlook for European banks with the sector set to stabilise through valuation support, improved profitability and a less volatile economy in the Eurozone.
Nicolas Simar, Head of the Equity Value Strategies at ING IM said: “In terms of valuation support, most of them still trade at a discount versus their tangible book value which remains too cheap to ignore. The sector has been de-rated significantly over the last 5 years due to balance sheet repair. We have come to the end of this phase as most of them are comfortable from the Basel 3 capital requirement and will be able to grow their loan book in the future.”
In terms of improved profitability, ING IM expects the banks’ Return on Equity (RoE) to improve in a recovering Eurozone area with the expectation of generating a low double digit RoE over the next two to three years. At the same time, the investment manager sees a declining Cost of Equity (CoE) due to a decreasing sovereign spreads, which is especially pertinent to southern Europe. Therefore, the discount to book value will disappear in the next few years.
Nicolas Simar continues: “As the economy stabilizes within the Eurozone, rising PMIs including the periphery over the last 6 months should progressively lead to a stabilization in Non Performing Loans (NPL) and declining provisions that will support earnings growth for the sector.”
ING IM believes that we are entering a new cycle for Eurozone banks after 5 years of deleveraging and balance sheet repairs. As most banks do comply with the capital requirements from Basel 3, the investment manager highlights they can now focus back on shareholders’ returns by increasing dividends from a very low payout level. This currently stands at around or below 30% versus the long term average between 40-45%.
Nicolas Simar concludes: “While European banks do not currently offer a high dividend yield, their ability to increase it over the next two to three years is substantial and will attract more interest from investors.”
“The credit growth remains supportive in the US market which is very close to turning the corner in Europe. While we do recognize the Eurozone periphery still shows credit growth contraction, the change in credit growth has turned the corner, boding well for Italian/Spanish banks profitability prospects.”
Photo: Ricnava. Google Earth. Santander Acquires the Private Banking Business of BNP Paribas in Miami
As confirmed to Funds Society by sources familiar with the operation, Santander Private Banking has reached an agreement with BNP Paribas in Miami to take over its private banking division, with approximately $3 billion in assets under management.
The news was reported to the staff of both companies last Friday. On becoming aware of the transaction, Funds Society contacted Santander for further details; the company, however, refrained from making any comments.
“BNP Paribas Wealth Management has decided to sell its activity in Miami as part of Wealth Management’s overall strategy to focus on markets where the bank has a retail banking presence or where its Wealth Management platform is more developed. BNP Paribas Wealth Management remains fully committed to the US through its Bank of the West franchise, as part of the Group’s plan in the US. Additionally, BNP Paribas Wealth Management remains fully committed to Latin America and other international markets”, sources from BNP commented to Funds Society.
It had been rumored for months that, following orders from Paris, the French bank had hung up its “For Sale” sign. Prior to Santander, Safra Bank, amongst others, had clearly shown an interest in BNP Miami, but it was the Spanish institution that finally reached an agreement of which the financial details have yet to be disclosed.
BNP Paribas Wealth Management’s workforce in Miami is headed by Eric Georges as president and CEO, and consists of 90 people, 20 of whom are bankers; these employees will join the staff of Santander Private Banking.
BNP Paribas has been offering wealth management services in Miami for Latin American clients since 1983. The Wealth Management division of BNP, in which private banking services are integrated, has more than 6,000 employees in 27 countries.
BNP Paribas’ portfolio consists mainly of Latin American clients. The transfer of portfolios for their integration in Santander will proceed according to the implicit consent of the client. BNP clients shall therefore be notified of the transaction, and, unless the client states otherwise, the transfer of portfolios will follow.
Léopold Arminjon, gestor del Henderson Horizon Pan European Alpha fund. Destacar entre la multitud
We were not surprised to see European equities perform strongly in 2013. Valuations started 2013 at very low levels and, with Mario Draghi, President of the European Central Bank, committed to returning stability, investors allocated to equities again at the expense of their bond holdings – a theme that we expect to continue until interest rates return to more normal levels.
It is important to recognise, however, that the upwards move in markets in 2013 was driven largely by sentiment, in anticipation of faster growth in corporate profits for 2014. Companies now need to meet these expectations, with improving earnings acting as a catalyst to further share price gains, or there could be repercussions for European equities.
Improvements in the global economy are cause for optimism, but it is probably fair to expect a higher level of share price volatility in 2014. Indeed we have already seen evidence of this in the first three months of the year, with two stockmarket falls of over 5.0%, prompted by broadly disappointing results for the fourth quarter of 2013, US tapering-induced emerging market fears and, most recently, concerns over the Ukraine.
While stockmarket volatility and political uncertainty are not welcomed by investors they provide a good opportunity for long/short strategies – funds that are designed to make money from markets that go down as well as those that go up, although returns are not guaranteed. Long/short funds can quickly reduce their net exposure to equity markets, which can help to preserve client capital when markets are falling. Equally, when fear looks overdone, they can increase their exposure to individual stocks and subsequently benefit from any market rises.
Of the risks themselves, the developments in the Ukraine are clearly the most immediate. Economically, it makes no sense for either Russia or the West to allow the conflict to escalate. Putin has seen the Rouble depreciate considerably and the Russian equity market tumble. Equally, Germany is still thirsty for Russian energy supplies and will not want to risk the fragile recovery that is coming through in Europe.
A lesser-discussed, but equally important, factor for fund returns is stock pricing correlations. Following the global financial crisis, there was very little dispersion in price movements, indicating that investors were buying or selling primarily in response to macroeconomic news, rather than company fundamentals. Yet 2013 saw stock pricing dispersion notably higher, increasing the focus on the qualities or shortcomings of individual firms. And with correlations thus far remaining low in 2014, this supports our belief that stock selection will remain critical to generating a positive return for investors this year.
Léopold Arminjon, portfolio manager of the Henderson Horizon Pan European Alpha fund
Photo: Munerabig. Sura AM Grows 13.5% to 113.2 Billion Dollars in AuM
At the end of Grupo SURA‘s General Shareholders’ Meeting held in Medellin, the Company confirmed the excellent results obtained from its core strategy and announced that it shall continue to focus on growth through innovation, building greater synergies and expanding and developing its markets.
As the market was informed in recent days, one of the more important achievements last year in terms of the Company’s financial results was having obtained COP 781,794 million (USD 405.7 million) in net profits, for a YoY increase of 43.2 %. This was largely due to a 38.3% YoY increase in operating revenues totaling COP 924,511 million (USD 479.8 million). For its part, SURA Asset Management S.A., Grupo SURA’s subsidiary in the pension, savings and investment sector ended with COP 219.2 billion (USD 113.2 billion) in Assets Under Management for a YoY growth of 13.5%
Other important highlights included the following:
COP 437,433 million (USD 227.0 million) in earnings reported via the equity method, showing a growth of 35.9%, of which COP 213,295 million (USD 110.7 million) corresponded to Suramericana S.A. and COP 279,910 million (USD 145.3 million) to Sura Asset Management S.A.
In non-operating expenses, interest payable account fell by 47.9 % , given the Company’s lower level of indebtedness.
Total liabilities therefore declined by 14.1% to COP 762,782 million (USD 395.9 million) at year-end 2013.
Based on this level of results, the Shareholders approved a proposal submitted by the Company’s Board of Directors regarding a dividend increase of 15%, that is to say COP 390 per share over the upcoming 12-month period. Consequently, Grupo SURA shall be paying out a total of COP 255.498 million (USD 133 million) in shareholder dividends in the form of 4 quarterly installments.
Strategic Investments
For its part, SURA Asset Management S.A., Grupo SURA’s subsidiary in the pension, savings and investment sector ended with COP 219.2 billion (USD 113.2) billion in Assets Under Management for a YoY growth of 13.5%. As for its consolidated financial results, this Company posted operating revenues of COP 3.1 billion (USD 1.6 billion), which were 47.3% higher than for year-end 2012. Sura Asset Management S.A. continues to lead the Latin America Pension Fund market with a total of 16.7 million clients in 6 different countries, 9,822 employees and a market share of 23.4%.
Suramericana S.A., Grupo SURA’s Insurance and Social Security subsidiary, with a presence spanning 4 Latin American countries, reported COP 6.0 billion (USD 3.1 billion) in subsidiary income along with net subsidiary profits of COP 353 thousand million (USD 183 million). Its Shareholders’ Equity came to COP 2.1 billion (USD 1.1 billion) at year-end 2013. This level of performance, from both the financial and business standpoints continues to show SURA’s driving force within the Latin American insurance industry.
On the other hand, in 2013, the amount of international funds holding shares in Grupo SURA rose by 34% from 497 to 665. This reflects not just the Company’s robust financial position but also its adherence to high international standards which are important benchmarks for these firms to base their investment decisions.
Also, Grupo SURA was included for the third year running in the Dow Jones Sustainability World Indices given its performance both at home and abroad. This sustainability index plays an important role on the global stock exchanges, given the growing importance amongst the worldwide investor community to receive feedback and assessments with regard to the long-term business models and practices of potential investees.
Grupo SURA also announced the progress made so far in getting ready for the changeover to the new IFRS (International Financial Reporting Standards) accounting system, as required by the Colombian Regulatory Agencies. Also it shall be working on implementing the Sarbanes Oxley Act, which shall allow it to deploy advanced Corporate Governance and Information Transparency practices, thereby complementing the Company’s efforts in this respect.
. Duff & Phelps Opens New Office in Spain and Underscores its Commitment to Growth in Europe
Duff & Phelps Corporation, a global valuation and corporate finance advisor, has announced the opening of a new office in Madrid, Spain. Managing Director Javier Zoido will serve as country leader for the new office.
Duff & Phelps works with many of the leading Spanish-listed companies, private equity firms and legal advisors. The new office in Madrid serves as a base in the region, from which to expand relationships with both existing and new clients. Mr. Zoido will drive growth of the business across Spain and serve as the primary contact for Duff & Phelps core services, notably valuation, restructuring and M&A advisory.
“The opening of our new office in Madrid underscores the firm’s commitment to growing our business in Europe,” said Jacob Silverman, President of Duff & Phelps. “As the economy improves in Spain we anticipate greater needs for our valuation and corporate finance advisory services in the market,” added Silverman.
“The new office in Madrid will enable us to better serve our clients in the region. Coverage of the Spanish market aligns very well with other European teams in our existing key markets,” added Yann Magnan, European Valuation Advisory Services leader.
Javier Zoido is a managing director in the Madrid office, country leader for Spain, and part of the Valuation Advisory Services business unit. He has more than 13 years of experience in valuation and corporate finance.
Javier has performed valuation assignments for the valuation of business enterprises, financial assets, equity securities and intangible assets. These valuations have been for the purpose of assisting clients in tax and financial planning and reporting, transaction advisory support, strategic planning and litigation support. His engagement highlights include purchase price allocations and asset valuations for financial reporting purposes under IFRS and US GAAP; intangible asset and goodwill impairment tests; equity and asset valuations for tax purposes; valuation of private equity portfolios; and fairness opinions.
Javier started his career at a Spanish consulting firm. In January 2001, he joined Ernst & Young Corporate Finance in Madrid, where he was a manager, before joining the London Office of Duff & Phelps in 2006 where he has held positions as Vice President, Director, and Managing Director. Javier received his master’s in finance from the Escuelas de Finanzas Aplicadas in Madrid, his bachelor’s in economics from the Universidad Complutense de Madrid and has post/graduate courses in Harvard University. Javier is fluent in Spanish and English.
He has published articles, including “El proceso de purchase price allocation sus implicaciones para las empresas españolas: enfoque en los activos intangibles” Análisis Financiero Internacional – 1st Quarter, 2008.
Foto: Narch, Flickr, Creative Commons.. Luxemburgo da un paso adelante en transparencia fiscal con la firma de FATCA
The agreement between the Government of the United States of America and the Government of the Grand Duchy of Luxembourg to improve international tax compliance and to implement FATCA (Foreign Account Tax Compliance Act) has been signed today, Friday March 28, 2014 in Luxembourg.
On 27 February 2014, the Luxembourg and United States negotiating teams agreed on the substance of the Model 1 Agreement.
ALFI welcomes the signature of this Intergovernmental Agreement (IGA).The association has been working hard to ensure that its members are best prepared for the implementation of FATCA. A Q&A document is being finalized by ALFI’s FATCA implementation working group. The working group comprises representatives of asset managers, management companies, securities service providers, audit firms, law firms, the Luxembourg Pension Funds Association and information management firms. The Q&A document will serve ALFI members as a reference document when it comes to implementing FATCA.
As part of the signing of the FATCA Model 1 intergovernmental agreement between Luxembourg and the United States dated 28 March 2014, the Luxembourg Tax Administration has set up two working groups bringing together different actors from the public and private sectors in order to implement the automatic exchange of information under this agreement.
The first working group focuses on general issues relating to the implementation of the agreement, while the second will deal mainly with technical questions regarding the electronic communication of information between reporting financial institutions and the Tax Administration (like communication channels, format etc.)
M&A Investors Luxembourg SA has launched its first Luxembourg-domiciled investment company, M&A Capital Fund SICAV- SIF SA. M&A Capital has scheduled the closing of its first sub fund, M&A Dynamic Return Europe Fund, for May 2014.
M&A Capital’s launch marks the expansion and continuation of the proven track record of M&A Investors Luxembourg SA fourteen years of investments throughout Europe. The investments of M&A Dynamic Return Fund will be managed by a dedicated team of experts comprised of the management of M&A Investors Luxembourg, which will co-invest equity in the fund, and renowned external real estate professionals based in Zurich, London, Luxembourg and Prague.
M&A Capital targets to raise Eur 100 million that will strategically be invested to provide capital-solutions to residential, commercial and mixed-use real estate developers with strong ongoing projects but requiring capital for completion. The Fund will invest in the forms of equity, preferred-equity and mezzanine loans in projects based in Switzerland and wealthy north European markets.
The fund will seek to generate premium returns through its expert added-value contributions by targeting wise investments and utilizing the team’s unparalleled network of local and global real estate and financial services professionals. M&A Capital has the unique ability to proactively source the best off-market deals before they become public.
“We aim to capitalize on the growing demand for capital in the real estate credit markets by providing capital to best in class developers, participating in the project management, and providing our financial engineering and deal structuring expertise for each investment development “, says Marc E. Cottino, Chairman of the Fund.