Cayman National Bank, together with its sister company Cayman National Trust Company, confirmed that it has experienced a data hack. Responsibility for the data theft was claimed on Sunday 17 November 2019 by the hacker or hackers known as Phineas Fisher, which is offering other hackers $100,000 to carry out politically motivated hacks. The bank reported it as soon as it was made aware and is in the process of notifying their customers of the data breach. It has also set up an email to deal with client inquiries.
“It is known that Cayman National Bank (Isle of Man) Limited was amongst a number of banks targeted and subject to the same hacking activity. A criminal investigation is ongoing and Cayman National is co-operating with the relevant law enforcement authorities to identify the perpetrators of the data theft. Cayman National takes any breach of data security very seriously and a specialist IT forensic investigation is underway, with appropriate actions being taken to ensure that the clients of Cayman National’s Isle of Man bank and trust companies are protected” the bank said in a statement.
The Isle of Man Financial Services Authority and Information Commissioner’s Office, along with the Cayman Islands Monetary Authority, have been informed and are working with Cayman National in the Isle of Man.
Any customers with questions in the meantime should email dataenquiry@caymannational.im. Periodic updates will also be available at www.caymannational.im
“Cayman National, along with virtually every other international banking group, is not immune from the constant attempts by hackers to gain access to confidential data”, stated Cayman National Bank (Isle of Man) Limited’s Managing Director, Nigel Gautrey. “In this instance, and despite the best efforts of leading data security consultants, this criminal hacking group has breached our system – although to date we have detected no evidence of financial loss to either our customers or Cayman National”.
Cayman National Bank (Isle of Man) Limited is a subsidiary of Cayman National Corporation Ltd (“CNC”). CNC, and its main banking subsidiary, Cayman National Bank Ltd. (“CNB”), are located in and operate from the Cayman Islands. All of Cayman National’s operations within the Cayman Islands, including CNB, are separate and distinct operations from the bank in Isle of Man. The two banks do not share common systems, databases, client information, or email platforms. CNC is confident that the theft is contained within Cayman National Bank (Isle of Man) Limited and Cayman National Trust Company (Isle of Man) Limited only, and does not affect CNB or any other operation in the Cayman Islands.
Pixabay CC0 Public Domain. Neuberger Berman crea un nuevo equipo de renta variable en Japón
Neuberger Berman announced its first Japan-based equities team, to be led by Keita Kubota, who joins as a Managing Director and Senior Portfolio Manager. The team will manage a “Japan Equity Engagement Strategy” seeking attractive returns through active engagement and constructive dialog with Japanese small/mid-cap companies in which the team invests. The strategy will be offered to both institutional and high-net-worth clients.
Kubota joins from Aberdeen Standard Investments, where he started his career over 13 years ago and most recently served as Deputy Head of Japan Equities. He was the investment director on Aberdeen Standard Investments’ Japan large cap strategy and small cap strategy, both of which were managed with an engagement strategy and offered to large institutional clients across Europe, Asia and Latin America.
Two analysts, one of whom will specialize in ESG investing, will support Kubota. Naoto Saito, joined Neuberger Berman in September as a Senior Research Analyst and has a generalist focus. Saito previously served in research roles and covered a broad range of companies across the Japanese equity market at Balyasny Asset Management, CLSA Securities and T. Rowe Price. With diverse experience as well as deep knowledge in ESG engagement, the team will seek to generate additional value by offering insights and knowledge sharing on ESG investing with portfolio companies.
“We look forward to the further expansion of ESG investing in Japan as companies have increased their awareness of corporate governance and other material factors. We think encouraging Japanese companies to improve their ESG factors through our active engagement can generate superior returns. Mr. Kubota and his team are bottom-up stock pickers with a focus on in-depth proprietary research,” said Ryo Ohira, Head of Neuberger Berman East Asia. “They are active, long-term investors who engage deeply and frequently with company management. Most importantly, Mr. Kubota has helped deliver long-term performance for his clients – which is our firm’s mission.”
Neuberger Berman has been in Japan for 15 years and currently manages over $53 billion in client assets locally having grown from $13 billion in 2015. For largely an institutional client base, the firm manages fixed income, alternatives and equity portfolios. Neuberger Berman is recognized in Japan as a leader in the ESG investing space, reflected in the firm winning the first ever Tokyo Financial Award for ESG Investing.
“We’re happy to welcome Mr. Kubota and team and know they are a fit our firm’s culture and core strengths. The group expands our global platform, bringing another long-term market perspective with a focus on active/ESG engagement in Japan, the third largest equity market in the world. We look forward to their capabilities helping client globally,” said Joseph Amato, President and Chief Investment Officer, Neuberger Berman.
Pixabay CC0 Public Domain. J.P. Morgan lanza un fondo sobre terapias genéticas que aprovecha el aprendizaje automático
J.P. Morgan Asset Management (JPMAM) is pleased to announce the launch of JPMorgan Funds – Thematics – Genetic Therapies in Europe, JPMAM’s first actively managed fund which combines both machine learning and active equity insights. The new fund leverages research carried out by UBS Global Wealth Management’s Chief Investment Office (UBS CIO) within its Longer Term Investments framework, and is being distributed by UBS initially.
Genetic therapies represent a once-in-a-generation breakthrough in the world of medicine. These treatments offer the hope of a cure for patients with serious inherited diseases, by modifying genetic information to address the underlying causes of disease. Today they are at an inflection point, moving from the clinic to commercial reality. This should generate high growth rates for companies operating in the space, and could prove highly disruptive for incumbent companies in the pharmaceutical industry if the technology proves to have wider applications. JPMAM’s Genetic Therapies fund provides the opportunity to investors to gain diversified exposure to this new and exciting theme, and can help to hedge the risk of disruption to existing healthcare portfolios.
The fund will be co-managed by Yazann Romahi, Berkan Sesen and Aijaz Hussein. The portfolio management team sit within JPMAM’s Quantitative Beta Strategies (QBS) team, a team that specializes in quantitative portfolio management and are experts in developing innovative machine learning based technology solutions. Several members of the team hold PhD’s in Artificial Intelligence.
The fund has been designed to combine the strength and reach of JPMAM’s proprietary thematic engine, ThemeBot, with the portfolio management and research capabilities of JPMAM’s global equity platform. ThemeBot can efficiently identify stocks exposed to a range of investment themes including genetic therapies.
Using natural language processing, ThemeBot will screen more than 10,000 stocks globally, rapidly analysing hundreds of millions of data sources, such as news articles, company profiles, research notes and regulatory filings to identify stocks with the highest exposure to the theme and generate a high relevance portfolio, accounting for liquidity, market capitalisation and profitability. The portfolio will invest across the market capitalisation spectrum and provide diversified exposure to both innovative pioneers and established healthcare players. ThemeBot dynamically ensures only the most relevant stocks based on textual and revenue metrics are flagged for inclusion in the portfolio.
Once ThemeBot has selected the stocks it thinks are most applicable to the genetic therapies theme, the QBS team will work with experienced industry career analysts from JPMAM’s global equity platform to vet and validate ThemeBot’s output, to ensure stocks most relevant to the theme secure a spot in the portfolio. The portfolio management team will have access to five dedicated healthcare analysts with an average experience of 19 years. Additionally, the portfolio managers will be able to call upon the expertise of JPMAM’s broader equity analyst community, made up of 51 sector specialists.
Yazann Romahi, Chief Investment Officer of Quantitative Beta Strategies at J.P. Morgan Asset Management, said: “In seeking to create data driven portfolios which brings together human and artificial intelligence, we’re able to offer investors thematic solutions which enable them to tap into some of the central investment themes shaping our world today.”
Mark Haefele, Chief Investment Officer at UBS Global Wealth Management, said: “Genetic therapies could develop into a profoundly disruptive technology for the pharmaceutical and biotechnology industry. Positioning portfolios to capture the economic benefits of disruption, while hedging or mitigating its effects on other assets, supports our goal to help our clients protect and grow their wealth over generations.”
George Gatch, CEO, J.P. Morgan Asset Management, said: “We’re delighted to partner with UBS in developing this new fund. We’re deploying our best Artificial Intelligence (AI) and Big Data capabilities combined with our global research expertise for this investment theme. Innovating jointly with our clients is an important priority for us.”
Christian Wiesendanger, Head of Investment Platforms and Solutions at UBS Global Wealth Management, said: “Developing new solutions with our partners is critical to implementing innovative ideas in clients’ portfolios. Machine learning is an exciting new tool for those looking to be at the cutting edge of investment management and will likely play a greater role in the years ahead.”
The fund’s C share class will have a Total Expense Ratio of 56 basis points.
Pixabay CC0 Public Domain. Azimut se constituye en los Estados Unidos
Azimut, Italy’s leading independent asset manager with €58 billion in AUM, established a US based newco named Azimut Alternative Capital Partners, with the purpose of investing in GP stakes of alternative managers specialized in the private markets space, including private equity, private credit, infrastructure and real estate. At the same time, Azimut signed an investment and shareholder agreement with AACP’s new CEO, Jeffry Brown, to execute the business plan, which, among other things, aims at building the leading private markets strategic permanent capital solutions provider and business operator.
AACP was established to build a next generation, diversified, multi-affiliate investment firm by acquiring initially minority stakes in alternative asset managers and providing strategic value-added services. AACP’s focus is on the large and growing, yet underserved segment of sub $ 3bn AUM alternative asset management businesses. Alternatives industry veteran Jeff Brown has over two decades of investing, due diligence and operating management experience in the alternatives asset management industry. Jeff was previously a Managing Director at Dyal Capital Partners (one of the leading minority stake investors in the alternatives asset management businesses globally, part of Neuberger Berman), and joined in its early days of formation. He founded and for five years led Dyal’s Business Services Platform which drove value creation in the Dyal portfolio companies across three private equity funds totalling $ 9bn in AUM. Prior to Dyal, Jeff was a Senior Managing Director at Bear Stearns Asset Management (“BSAM”). During his tenure at BSAM, he was Chief Development Officer and led the strategic expansion of the firm from $ 23bn AUM to $ 55bn AUM in four years. Prior to joining BSAM, Jeff held senior roles at Morgan Stanley Asset Management.
Jeffry Brown, CEO of AACP commented: “I am delighted to join the global Azimut family and look forward to building a next-generation multi-affiliate alternatives business leveraging the Azimut brand and my combined capabilities. Azimut’s strong reputation as a committed and steadfast long-term partner give me confidence that we will achieve the business goals targeted in the plan”.
Pietro Giuliani, Chairman of Azimut Holding, commented: “We are excited to have a top-notch professional such as Jeff on board with us in this long-term initiative. We strongly believe in the opportunity of investing into alternative managers in the US with a long-term approach and commitment, very much in line with our Group DNA. We are convinced that this partnership will be successful and will allow an important step forward in the alternative sector, complementary to what we are doing in Italy with the Azimut Libera Impresa project. The alternative asset managers in which we’ll invest will have a stable and trustworthy partner at their side, helping them to achieve their goals and growth targets.”
AZ US Holding, Azimut US sub-holding company, will carry out the transaction, involving a 10-year business plan with call/put option rights aimed at partnering with alternatives asset management businesses in the sub $ 3bn AUM space, helping them achieve their greatest business potential. In the base case of all the envisaged acquisitions, Azimut anticipates an investment of capital sufficient to achieve over $ 7 bn of pro-rata AUM (in excess of ca. $ 20 billion of affiliated AUM) in the next 10 years. The business plan also entails the entrance of further key senior managers over time, who have already been identified. Azimut and the management of AACP will cooperate to grow the business in the long term.
Oppenheimer & Co. acted as advisor in the creation of Azimut Alternative Capital Partners.
Allfunds, the largest investment fund distribution network in Europe and a leading wealthtech platform, has successfully finalized the acquisition of the Nordic Fund Market (NFM), from Nasdaq. The acquisition was announced in March 2019 and has been pending regulatory approvals and customary procedures.
With this operation, Allfunds total assets under distribution (AUD) increase to more than €530 billion and further strengthens its presence in the Nordic region. The Nordic Fund Market client portfolio will boost Allfunds’ presence in the Nordics at the same time as benefiting existing NFM distributors and fund managers with added value solutions, increased efficiency and advanced technology. Current NFM distributors and fund managers will become part of Allfunds’ distribution network in the region which already compromise more than 20 entities in Sweden, Norway, Finland, Denmark, Iceland and the Baltic countries.
Allfunds now has an established office in Stockholm which will provide services to the distributors and fund managers throughout the Nordic region. All employees working with NFM at Nasdaq in Stockholm were recruited, one being the former CEO of Nasdaq Broker Services Mattias Hammarqvist who is the Head of Allfunds Sweden.
“I am very excited that we, with new office will be able to leverage on the technology, services and benefits Allfunds global platform provides. It enables us to improve our offerings to current distributors and fund managers as well as to attract additional,“ said Mattias Hammarqvist, Head of Allfunds Sweden.
With the new office, distributors and fund managers are able to leverage the technology and know-how of experts in the region while accessing a cost-efficient way to distribute funds and reducing operational risk. This agreement and access to the global platform will benefit local financial institutions who can take advantage of the global scale and specialisation within Allfunds as well as to benefit from state-of-the-art technology and increased service offering to meet challenges in the industry.
Juan Alcaraz, CEO of Allfunds, said: “We are very excited to close this acquisition that allows us to increase our presence in the Nordics by bringing our leading fund and wealthtech platform to the region while strengthening our global position. The Nordic markets deserve a trusted and global B2B partner to boost and support local financial institutions. The integration of NFM’s business and infrastructure into our company and our solutions further enhances our innovative offering, disruptive and value-added services that will now be made available to Nordic entities and help them achieve their objectives.”
Foto cedidaOlga Kosters, directora de Private Debt Secondaries. Tikehau Capital ficha a Olga Kosters como nueva directora de Private Debt Secondaries
Tikehau Capital, an alternative asset management and investment group, appointed Olga Kosters as Head of Private Debt Secondaries.
Kosters’ role will be to launch the firm’s private debt secondaries business. She will be based in New York and report locally to Tim Grell, Head of Tikehau Capital North America, and to Cécile Mayer-Lévi, Head of Private Debt activity.
Olga Kosters (47) has twenty years of investment and structuring experience in private and public capital markets. Prior to joining Tikehau Capital Kosters advised large institutional investors on the US private credit strategies while at StepStone Global, and led the execution of corporate private debt strategy at Zurich Insurance Group. Prior to this Kosters has held several positions at the European Bank for Reconstruction and Development (EBRD) in London.
“Over the last fifteen years Tikehau Capital has grown to become one of the most well-capitalised asset management firms globally and has developed a deep network of institutional investors and strategic partners. The firm keeps its focus on underwriting, and continues to invest a large portion of its own capital alongside its investors,” said Olga. “In a context of fast growth, the team has successfully maintained its entrepreneurial spirit and a strong set of core values. I am delighted to join the team to build the new private debt strategy.”
Cécile Mayer-Lévi, Head of Private Debt activity, commented: “We are delighted to welcome Olga to our team and expand our offer to the secondaries market in private debt. We see that this market is emerging and we believe it could develop significantly in the coming months.”
Kosters received an MBA in finance from Hofstra University, and is a CFA charterholder.
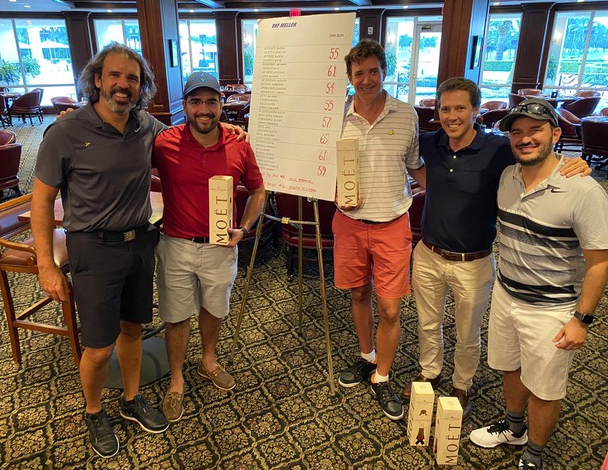
Clients and friends of BNY Mellon met on November 1 at South Florida’s premier golf resort, Trump National Doral, to listen to Carlos Rodriguez, senior CPM of Newton IM, talk about the BNY Global Real Return and the BNY Global Equity Income Funds. Afterwards, they enjoyed a Scramble golf tournament on the iconic Red Tiger golf course. Networking conversation followed at the Champion’s Bar and Grill.
During his presentation, which followed a speech by David Ayastuy, Managing Partner of Unicorn-the firm that distributes BNY Mellon strategies in US Offshore and Latam, Rodríguez went over the capabilities and differentiators of each of the strategies, mentioning that, “considering that we are living the longest bull market in history, it makes sense to have strategies that can handle the possible end of this cycle… A strategy that not only takes advantage of the upside but protects your investment in difficult times.”
In his opinion, “there are many signs that show that we are near the end of the cycle, it does not mean that it is going to happen this month but we are close, and we prefer to miss the last two innings of the bull market that participate in the first of the bear.”
The specialist placed special emphasis on the fact that, despite the US’ positive outlook, one must look outside to anticipate the global situation, “since in the last almost 10 years, the United States has only contributed to 17 % of global growth, so it is very good that things are fine there, but we care more about what is happening in China, and that is not very positive right now.”
After the presentation, the attendees enjoyed a lunch and got ready to play a round of golf. The winners of the tournament were:
Norberto Quirno Costa – UBS
Ezequiel Sporleder – UBS
Agustín de Estrada – Aurora Partners (Bolton)
Carlos Rodríguez – BNY Mellon – Newton IM
Agustin de Estrada also won the longest drive and Carlos Marranzini of Merrill Lynch took home closest to pin.
Pictet Asset Management plans to open an office in New York by mid-2020, according to Mutual Fund Wire, which cited Laurent Ramsey, CIO of the European firm, during an internal meeting. A Pictet spokesmen did not immediately respond to requests for comments from Funds Society.
In theory, Liz Dillon, Head of Sales for US Sub-Advisory and Intermediaries of Pictet, will leave her current residence in London to head the new office, where about 12 people would be employed.
The office will cover Pictet’s institutional, offshore and subadvisory businesses.
Pictet Asset Management is an independent asset manager, overseeing over USD 192 billion (CHF 191 billion/EUR 176 billion/GBP 156 billion as at 30th September 2019) for their clients across a range of equity, fixed income, alternative and multi asset products. They provide specialist investment services through segregated accounts and investment funds to some of the world’s largest pension funds, financial institutions, sovereign wealth funds, intermediaries and their clients.
Foto cedidaPhoto: The $4 billion mixed-use Miami Worldcenter is underway on almost 30 acres in the heart of Downtown Miami.. Foto: Participant Capital
Participant Capital Advisors, LLC, a Miami-based real estate investment firm, with over US$3B in projects under development, has announced today that it has been approved to operate as a Registered Investment Adviser (RIA) in the State of Florida.
Established in 2018 as an affiliate of Royal Palm Companies, a developer with an extensive track record of more than 40 years, Participant Capital empowers investors with direct access to premium real estate projects and allows them to invest side by side with the developer, from the ground-up.
“Credibility of our experienced and knowledgeable investors is the preeminent asset for our company,” said Claudio Izquierdo, Chief Operating Officer of Participant Capital. “As we grow together and leverage our global distribution efforts, we want to make sure we provide a successful investment experience to those who are placing capital in uniquely positioned real estate projects.”
Participant Capital is currently partnered with over 40 distributors operating throughout Latin America and Europe and will be expanding to Asia and the Middle East over the next year. Its investment portfolio continues to grow with new world-class developments in South Florida and beyond.
Pixabay CC0 Public Domain. Scharf Investments lanza el primer fondo UCITS junto a iM Global Partner
iM Global Partner, a leading investment and development platform focused on acquiring strategic investments, and Scharf Investments, an investment firm providing high quality value investment strategies, have announced the launch of iM Scharf US Quality Value fund, the first collaborative UCITS fund between the two firms. The equity fund will seek to deliver compelling risk-adjusted absolute returns through a value-focused, fundamental, bottom-up approach.
The fund, which launched on September 12, 2019, will give investors outside of the US access to Scharf Investments’ expertise for the first time, facilitated by the unique business model of iM Global Partner who acquired a 40% interest in the California-based US equity value asset manager a few months ago.
iM Scharf US Quality Value Fund will be managed by Scharf’s experienced investment team, with a similar investment strategy to its core equity flagship product which has a proven track record spanning approximately 30 years. The investment team looks for securities trading at significant discounts to estimated fair value as a margin of safety and high earnings predictability. The fund is not publicly offered to all investors in all jurisdictions.
Brian Krawez, President of Scharf Investments, said: “We are delighted with the launch of our first UCITS fund with iM Global Partner. It is a great opportunity for Scharf Investments to reach new markets and new investors. We look forward to working with iM Global Partner as we continue to develop and refine our worldwide presence.”
Jose Castellano, Deputy CEO and Head of International Distribution at iM Global Partner, added: “Scharf Investments is a proven leader in value-oriented equity asset management and has an exceptional track-record. Their core equity flagship strategy outperformed the Russell 1000 Value and the S&P500 by 3.5%, with lower volatility*. Their entry into the UCITS fund market will allow broader access to Scharf Investments products for institutional investors and we are thrilled to support their expansion internationally.”
Scharf Investments is a California-based investment firm founded in 1983. Managed by Brian Krawez, President and Investment Committee Chairman, the company has grown from 5 people and under $700m of assets under management in 2007 to 22 people and $3.3bn of assets under management today.
Scharf Investments currently manages four distinct strategies:
A long-only US equity strategy, the firm’s core equity strategy on which the three other strategies are based
A long-only multi-asset strategy
A long/short hedged US equity strategy
A long-only global equity strategy
iM Global Partner, with its unique business model in Europe, has become a leading investment and development platform focused on acquiring strategic investments in best-in-class traditional and alternative investment firms in the U.S., Europe and Asia. Through the launch of this new UCITS fund, iM Global Partner continues its development as it pursues its dual objectives to both support its Partners with its management and distribution expertise and ensure investors have access to unique strategies that were not previously available.
iM Global Partner currently has strategic minority investments in five partners, including two outstanding complementary US large-cap equity managers with proven track records and a focus on downside protection.