Insigneo announced the addition of Jorge Oliveira to its network of financial advisors as Senior Vice President.
With a career spanning more than two decades in the field of wealth management, Oliveira has provided advice to individuals, families, and corporate leaders in the planning and preservation of complex wealth. His expertise in investment strategies, risk mitigation, and long-term estate planning has been key in guiding clients to make decisions aligned with their financial goals, the firm stated in a release.
“With 20 years of experience as a financial advisor, I’m excited to join Insigneo and leverage its platform to continue prioritizing my clients’ success,” said Oliveira.
Before joining the firm specialized in wealth management, he held key positions at leading institutions such as Oppenheimer, Morgan Stanley, Wells Fargo, Smith Barney, and Merrill Lynch, where he built strong expertise in designing sophisticated financial plans, tax strategies, and multigenerational investment structures for high-net-worth clients. He holds a degree in Accounting from St. John’s University in New York and a certification in financial planning from NYU – School of Continuing and Professional Studies, according to his LinkedIn profile.
“We are thrilled to welcome Jorge Oliveira to Insigneo,” said Alfredo Maldonado, Market Head for New York and the Northeastern United States. “His deep industry knowledge and commitment to excellence in client service make him an ideal addition to our team,” he added.
Oliveira’s integration into Insigneo’s network represents another step in the firm’s growth strategy, as it continues to add talent and experience to further enhance the quality of its wealth management services.
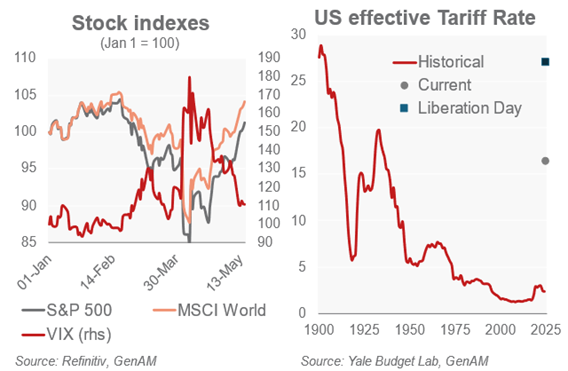
Markets appear to have breathed a sigh of relief following the truce agreement between Washington and Beijing, which includes a reduction in tariffs on Chinese exports to the U.S. from 145% to 30% for a period of 90 days. “The news that China and the U.S. have rolled back policies that, in practice, amounted to a trade blockade between the two countries has been warmly welcomed by the markets. Investors are hopeful that this three-month window will be used to negotiate a lasting agreement that, while unlikely to remove all tensions stemming from strategic competition, at least provides a more predictable environment for companies,” says Sean Shepley, Senior Economist at Allianz Global Investors.
According to experts, markets gained ground, led by cyclical sectors. “In the U.S., inflation stability offered slight relief, though the rise in durable goods prices was not fully offset by the slowdown in service inflation. In Europe, cyclical sectors such as automotive rebounded, though sector rotation began to show signs of fatigue by the end of the period, with defensive sectors making a comeback. Investors are now waiting for a new catalyst, as the good news appears to be already priced in,” summarizes Edmond de Rothschild AM.
According to the firm’s analysis, U.S. economic data for April have yet to reflect the impact of the increased tariffs, either in prices or consumer spending. “The Consumer Price Index (CPI) for the month stood at 2.3%, so the anticipated acceleration has not yet materialized, not even in goods. Services continued to ease. Meanwhile, falling oil prices helped slow energy and food inflation. The Producer Price Index (PPI) showed imported goods prices rising slightly from 2.3% in March to 2.5%,” they note.
With PMI releases still pending this week, analysts at Banca March believe market attention in the U.S. will focus on negotiations over the tax reform promoted by President Trump. “According to House Speaker Mike Johnson, the proposal could go to a vote next Monday. The new law gains relevance after Moody’s downgraded the U.S. credit rating. Market attention will also be on Treasury auctions, particularly a $16 billion 20-year bond issue scheduled for Wednesday,” they explain.
The Truce Between Washington and Beijing
In the view of Paolo Zanghieri, Senior Economist at Generali AM (part of Generali Investments), the unexpected and swift agreement to temporarily de-escalate trade tensions between China and the U.S. shows there is a sort of “Trump option,” even if the exercise price is higher than expected. “Following the truce, we have revised our growth forecasts for the U.S. and the eurozone to 1.6% (from 1%) and 1% (from 0.9%), respectively, and reduced our forecast for Fed rate cuts from three to two by year-end. In terms of asset allocation, we have strengthened our preference for investment grade bonds while maintaining a slight overweight in equities. The peak of uncertainty has passed, and trade protectionists no longer seem to hold the upper hand in the U.S. administration—but caution is still warranted,” explains Zanghieri.
He first points out that the truce with China is temporary, with the suspension of punitive tariffs set to expire on July 8, though he expects it to be extended until the U.S. reaches agreements with key trading partners. “This extension, while welcome, would not fully resolve the uncertainty that continues to hinder corporate capex planning,” he adds.
Second, he notes that the universal 10% tariff and the 25% tariffs on steel, aluminum, automobiles, and auto parts remain in effect, with few exemptions, which will impact both growth and inflation. “U.S. trade authorities are still assessing potential security threats from imports of semiconductors, pharmaceuticals, critical minerals, and commercial aircraft, among others, which could trigger new sector-specific tariffs,” he explains.
Lastly, Zanghieri highlights that the only near-finalized deal—with the UK—has very limited scope and includes provisions aimed at excluding China from British supply chains in strategic sectors. “Beijing would strongly oppose this becoming a standard feature of all trade agreements,” he concludes.
Navigating the 90-Day Pause
In the view of Andrew Lake, Chief Investment Officer and Head of Fixed Income at Mirabaud Asset Management, the rhetoric may sound familiar, but this latest chapter in the tariff saga comes with a notable shift: “The real negotiations are not between the United States and its trading partners, but between the White House and the U.S. bond markets.”
According to Lake’s analysis, a subtle yet significant change has emerged in recent weeks: Trump appears far less reactive to stock market volatility than during his first term, when he often measured his success by the performance of the S&P 500. “This time, the key indicator is U.S. funding costs. He wants lower Treasury yields, lower interest rates, and a weaker dollar. When Treasury yields started to break down in April, the tone changed. Now it is the bond market—not equities—that seems to be driving policy adjustments,” they explain. In Lake’s view, with most of the 90-day pause still ahead, markets remain optimistically positioned, buoyed by news of deals with the UK and China.
For Lake, the real question is whether financial markets, encouraged by optimism over tariffs, can look past current data and focus instead on the potentially better economic expectations now being priced in for the second half of the year.
“Clearly, we are in a worse position than at the start of the year, with 10% now seemingly the minimum tariff rate, but that is still much better than the situation just a few weeks ago. Doubts remain, but if this is now the ‘new normal,’ then we would expect agreements with other major trading partners to follow in the coming months. As we return to a ‘wait-and-see’ mode, our positioning remains cautious. Markets are rising on narrative, not fundamentals, and we have been reducing risk during these rallies. We prefer rotating into high-quality credit, where spreads have widened to levels we consider ‘recessionary.’ We are building exposure gradually at attractive entry points,” he concludes.
The Exemption for Dual-Class Share Products Is a Major Development and Will Drive the Industry in the Right Direction to Offer More Tax-Efficient and Lower-Cost Exposures, but It Will Not Happen Overnight, According to a New Study by International Consultancy Cerulli, in Collaboration With Nicsa
Interest in share class conversions comes at a time when ETFs are experiencing unprecedented growth, while mutual funds have seen consistent outflows.
Specifically, U.S. ETFs reached a record $10 trillion in assets in 2024, although active ETFs remained a small portion (around $900 billion by year-end). The dual-class share product is a way in which asset managers hope their active exposures will attract inflows through the ETF structure.
Asset managers view the dual-class share exemption as an opportunity to launch ETF products that carry the performance track record of the mutual fund while simultaneously offering greater tax efficiency.
“For asset managers, the dual-class share option offers the best of both worlds, as it allows the investor or their advisor to use their preferred structure and benefit from the associated advantages (for example, the greater tax efficiency of an ETF in a taxable account, or the certainty of the net asset value (NAV) of a mutual fund),” said Chris Swansey, associate director at Cerulli, the Boston-based consultancy.
When dual-class share products enter the market, a gradual rollout is likely, as wealth managers work through the business and operational complexities involved in offering these products.
Among the specific challenges cited in the Cerulli and Nicsa study are considerations related to Reg BI, operational challenges linked to the redemption mechanism for converting mutual fund assets into ETFs, and business economics, particularly the loss of 12b-1 fees and sub-transfer agency fees.
“One of the main issues will be the exchange mechanism. Solving infrastructure gaps will be costly, resource-intensive, and full of unknowns,” commented Swansey. “Although a wide variety of asset managers have applied to launch dual-class share products, we expect short-term use to be limited to firms that are testing the waters or have a business with lower risk of disrupting intermediary relationships,” he added.
In the long term, dual-class share products will lead the industry to offer active exposures that are tax-efficient and lower-cost within the client’s preferred structure. However, in the short and medium term, the asset and wealth management sectors will have to face operational and compliance challenges.
“Although it is not yet complete, the rollout of dual-class share products already has interesting implications for the industry,” said Jim Fitzpatrick, president and CEO of Nicsa.
“Asset managers need to be selective about which products to offer as ETFs in the form of a share class, taking into account what intermediaries and advisors want. We look forward to working with asset and wealth managers to identify solutions for the future,” he concluded.
The First Months of 2025 Have Been Highly Volatile and Turbulent for Global Markets; However, in Mexico There Are Signs That Suggest a Divergence From the Global Trend
According to figures and analysis by Franklin Templeton, an overview of the main investment vehicles in Mexico reflects the current performance of the local market: for example, Cetes have already accumulated a nominal return of 4% so far this year; Mexican Bonds and Udibonos, in turn, are experiencing the best start to the year in a long time; while Mexican Fibras and stocks, which were severely punished in 2024, now hold the second and third places in performance within local markets.
Additionally, considering that the dollar has depreciated by around 6% as of the end of April, the appeal of Mexican stocks for foreign investors has increased.
The peso has remained relatively stable despite external pressures, particularly those related to the trade policy of its powerful neighbor, the United States—a nation that is also its main trading partner, yet this has not prevented the imposition of tariffs.
This outlook of attractive returns in the Mexican market is present even despite the recession expectations for the country’s economy and the evident slowdown that is already being observed.
One key factor has been the control of inflation in Mexico, which has sent signals of relative stability for the country’s economy. The control of inflation has especially benefited debt instruments.
Franklin Templeton notes in its analysis that in this context, investments in conservative assets such as bonds can remain a smart investment decision for those who prioritize consistent, low-risk returns aligned with the investment horizon required by each manager.
Some other factors, such as the large fiscal deficit reported by the country last year—around 5.9% of GDP, the highest in more than three decades—apparently show signs of being under control and in the process of consolidation, that is, reduction, and have not affected investor sentiment; on the contrary.
Even the economic slowdown process, already noted above, is a factor that for now concerns investors little, considering that there are geopolitically much weightier factors that lead investors to view Mexico as an attractive and, above all, low-risk investment option compared to others.
UBS Private Wealth Management announced that banker Lin Reynolds is joining the New York office of the Swiss-based bank as Senior VP of Wealth Management, as a member of the Wright Hoffman Reynolds Group.
“I’m proud to announce that Lin Reynolds has joined our UBS 1285 Avenue of the Americas Private Wealth Management office in New York City,” wrote Thomas Conigatti, Executive and Market Director of UBS Private Wealth Management in New York, on his LinkedIn profile.
Conigatti said that the banker will join William Wright, Matthew Hoffman, and Audrey Kaus as a member of the Wright Hoffman Reynolds Group, a team specialized in wealth management within UBS Private Wealth Management. The team is made up of professionals with extensive experience in financial advising for high-net-worth individuals and families.
Reynolds worked as a banker for nearly 9 years at J.P. Morgan Private Bank in New York, holding the position of Executive Director. Previously, she worked at JP Morgan Chase & Co, completing three rotations within the Chase Leadership Development Program Analyst.
Graduating Summa Cum Laude from Lake Forest College, she also holds a Master’s degree in Economics from American University.
Financial asset management in investments in Mexico shows signs of resilience, despite the adverse conditions that have prevailed for several months. That is the conclusion of SPIVA (short for S&P Indices Versus Active), a semiannual report from S&P Dow Jones Indices that compares the performance of actively managed funds with that of their benchmark indices. This study analyzes the performance of equity and fixed income funds over different time horizons (1, 3, 5, and 10 years).
The SPIVA report for Mexico was recently published, with data as of the end of the first half of last year, providing insight into how investors are managing both short- and long-term challenges in the Latin American country. According to the report, in 2024, difficult market conditions were present for active managers.
Thus, funds in the Mexican Equity category underperformed by 41.9% during the first six months of 2024, a figure that increased to 85.4% over a 10-year period.
The report also presents SPIVA’s initial analyses of two new categories of funds domiciled in Mexico: U.S. Equity and Global Equity. In the first half of 2024, 50% of U.S. equity funds denominated in pesos underperformed the S&P 500®, with underperformance rates of 85% and 86.7%, respectively, over the 5- and 10-year periods.
Meanwhile, Global Equity vehicles (in Mexican pesos) faced a more difficult first half of 2024, with 77.8% underperforming and 100% underperforming the benchmark index over the 5- and 10-year periods, respectively.
In Mexico, the S&P/BMV IRT index, the most important in the industry, started the year in negative territory and closed the first half of 2024 with a 7.2% decline. Meanwhile, the S&P 500 rose 24.2%, and the S&P World Index rose 21.2% in Mexican pesos during the first half, outperforming local equities.
The Mexican stock market offered broad opportunities for outperformance, but fewer than half of local equity funds outperformed the benchmark index in the first half of 2024. The performance of the S&P/BMV IRT was led by a few key contributors, resulting in a slight positive skew in stock returns, with an average drop of 5.1% compared to a median decline of 6%.
However, 56.8% of stocks outperformed the index during the first six months of the year. In a period when most stocks outperformed the benchmark, most Mexican equity funds took advantage of favorable market conditions for stock selection, with underperforming funds representing only 41.9% of the total during the first half of 2024.
Argentine President Javier Milei promoted the cryptocurrency $LIBRA this year from his personal account on the social media platform X as part of a private project aimed at “funding small Argentine businesses and ventures.”
Although he later deleted his initial post, thousands of investors backed the digital asset, causing its price to rise exponentially within minutes. However, just hours later, $LIBRA suffered a sharp crash, resulting in significant losses for users. The case became an institutional scandal with judicial overtones, gained international attention, and rekindled discussions about a potential “pyramid scheme.”
Nevertheless, the Argentine crypto ecosystem views the $LIBRA incident as an isolated event and continues moving forward with its projects, including a vault for cold storage of digital assets and the world’s first bitcoin-native stock exchange.
A Custody Bunker for Crypto Assets
The term “bunker” is typically associated with a secret location, perhaps in a basement, accessible only after passing through multiple security gates and locks.
In Argentina, Prosegur Crypto, the institutional digital asset custody service of Prosegur Cash, inaugurated the second cold storage crypto custody bunker in Latin America. The first in the region was established in Brazil in 2023.
Far from the usual mental image of a bunker, the Prosegur vault holds an object resembling a briefcase, but its contents—blockchain private keys of digital assets—are protected by multiple layers of physical and virtual security.
2025 was already expected to be a key year for cryptocurrencies, mainly due to U.S. President Donald Trump’s willingness to create a favorable regulatory environment for the market. He has openly stated his desire for the U.S. to become the “global crypto capital” and has announced plans to establish a “strategic bitcoin reserve,” similar to the nation’s existing reserves of gold and oil.
Argentina’s chronic macroeconomic instability, triple-digit inflation rates over the past two years, and especially its capital controls have positioned cryptocurrencies—particularly stablecoins—as a viable, secure, and accessible option for the country’s population.
Argentina surpassed Brazil in total value of cryptocurrencies received—estimated at $91 billion—between July 2023 and June 2024, according to a report by Chainalysis. During the same period, over 60% of Argentine crypto transactions involved stablecoins. The country ranks 15th globally in cryptocurrency adoption on the cited blockchain data platform.
Expectations are high within the local crypto ecosystem, given the ideological similarities between Trump and Milei and the apparent rapport between both leaders.
In Argentina, there’s a growing sense that restrictions imposed by the Central Bank—preventing banks and fintechs from offering digital assets to clients—may soon be lifted. Beneath the surface, everyone seems to be preparing for that major shift.
Ready for When the Time Comes
“As part of the evolution of Prosegur’s traditional business, we view this bunker as a form of reverse innovation: transferring digital assets into physical form to ensure secure custody for our clients,” explains Hernán Ball, Regional Innovation Head at Prosegur Cash.
The vault is located in one of the company’s facilities, guarded by multiple layers of security. Inside the bunker lies the solution Prosegur offers to banks, fintechs, exchanges, funds, family offices, and investment managers: a secured PC, developed in collaboration with Israeli cybersecurity firm GK8, which stores the private keys of digital assets offline, ensuring 100% protection from cyberattacks and hacks.
In addition to operational security protocols, the company also offers institutional clients an insurance policy that covers 100% of the custodied amount.
Currently, banks and fintechs in Argentina are still restricted from offering crypto to their customers. Nevertheless, Ball notes that prior to launching the crypto vault, they met with the Central Bank, which assured them the regulations would be lifted this year. As a result, the company is fully prepared for the regulatory change.
Ball also confirms regular meetings with the Central Bank and the CNV (National Securities Commission), and that Prosegur is also engaging with financial institutions to offer its solution.
Awaiting a Transformational Shift
“Argentina is not only one of the countries with the highest crypto adoption, but also has several relevant projects. The high technical level of local developers and their proficiency in English helped create a strong ecosystem initially driven by NGOs and later by various crypto community projects,” says Rodolfo Andragnes, president of ONG Bitcoin Argentina, co-founder of Alianza Blockchain Iberoamérica, and organizer of Labitconf, the leading Bitcoin & Blockchain conference in Latin America.
If the regulatory framework changes, “it could boost the adoption of certain assets, including bitcoin. It would also be interesting to see bitcoin appear in bank investment portfolios,” he adds.
Iñaki Apezteguia, educator, crypto communicator, and co-founder of Crossing Capital, points out that “with the high inflation rates in recent years, crypto dollars are a very natural option for Argentines, who are used to thinking in terms of dollars.”
Beyond that, the country boasts important developments: Argentina is one of the few countries with a crypto pre-loaded debit card, allowing users to spend crypto while merchants receive the payment in legal tender (Argentine pesos). It is also a country where crypto mining is flourishing.
Apezteguia draws a comparison with the U.S., where banks are now allowed to custody crypto. “If the Central Bank lifts the restriction and banks can offer crypto, it would open a window to further accelerate adoption in the country. There are people who mistrust bitcoin simply because their bank doesn’t offer it. It could be a transformational change,” he says.
Brazil has better institutional conditions than Argentina for digital currency adoption, such as the ability to purchase crypto-related ETFs; in Argentina, access is through ADRs (American Depositary Receipts) of the exchange-traded fund. Additionally, the neighboring country has already piloted Drex, the digital version of the Brazilian real created by the Central Bank of Brazil.
However, “as regulation and specific tax treatment in Argentina start to take shape, Crossing Capital is beginning to explore its first corporate clients, as companies start to consider the crypto market as a valid alternative for capital appreciation,” he says enthusiastically.
Borja Martel Seward, a well-known figure in Argentina’s crypto community and founder of Roxom, the world’s first bitcoin-native stock exchange, takes it one step further: “In both retail and institutional segments, I see crypto in pure growth. Donald Trump is the first Bitcoin president of the United States, and expectations are very bullish. It’s an unprecedented situation, so we expect bitcoin to hit new all-time highs this year.”
“In Argentina, crypto adoption came naturally. We want Argentina to be an AI hub; in my opinion, the country is already a crypto hub, and institutional investment will grow,” he concludes.
In mid-2024, Seward and Nick Damico—former CTO of Bitpatagonia, one of Argentina’s largest Bitcoin mining companies—announced the launch of Roxom, the world’s first bitcoin-native stock exchange, securing a $4.3 million investment in a pre-seed funding round led by Draper Associates, the venture capital fund of Tim Draper.
This article was originally published in issue 42 of Funds Society Americas magazine. To access the full content, click here.
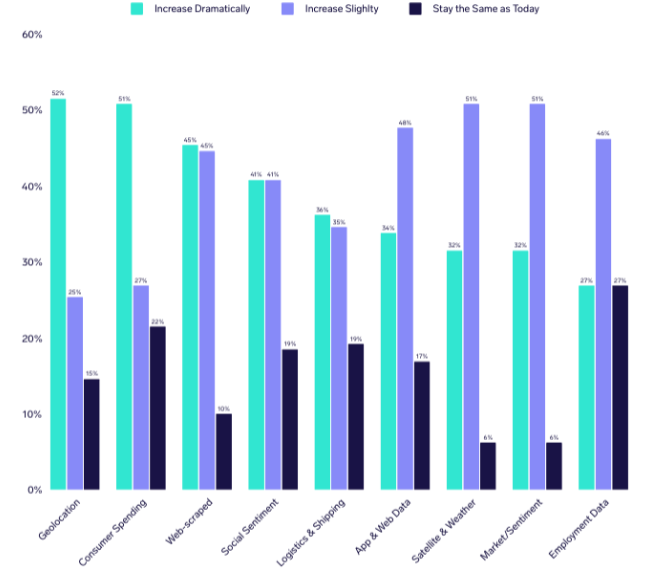
Asset managers plan to further increase their use of alternative data for research and analysis. Specifically, they are showing interest in emerging data types such as geolocation and consumer spending data. These are among the findings highlighted in the latest global report produced by Exabel and BattleFin.
The study, conducted with investment managers and analysts working at fund management firms overseeing a total of $820 billion in assets under management, found that 86% expect to increase their use of alternative datasets over the next two years. All data categories are expected to see increased demand, with 51% forecasting a drastic rise in the use of geolocation data over the next three years, and 50% anticipating significant growth in the use of consumer spending data.
The Exabel report, “Alternative Data Buy-side Insights & Trends 2025,” revealed that all surveyed managers and analysts in the U.S., U.K., Singapore, and Hong Kong currently use alternative data in some form. Nearly all respondents (98%) agree that traditional data and official figures are too slow to reflect changes in economic activity.
Consumer spending datasets are considered the most likely to provide a significant informational edge in the near future, according to the study. About 75% of respondents selected consumer spending data, compared with 50% who chose Natural Language Processing (NLP) and sentiment analysis, 45% who opted for social listening, and 43% who selected employment and labor mobility data. Only 7% chose satellite data.
The study also revealed that investment managers and analysts have developed experience in using alternative data: 61% said they began using it between three and five years ago, while nearly one in ten (9%) have used it for more than five years. Around 28% started using it between one and three years ago. Overall, their experience with these data sources has been positive, with 87% rating the process of using alternative data as good or excellent.
In response to these findings, Andreas Aglen, President of Exabel, stated: “Institutional investors have embraced alternative data as a key source of differentiated insight, and demand for alternative data as a critical component in generating alpha continues to accelerate. It is now even more evident that alternative data has become mainstream, serving as a vital source of information for investment managers worldwide.”
The following table shows fund managers’ forecasts for rising demand across different types of alternative data over the next three years, with all categories projected to grow.
According to forecasts from the latest Janus Henderson Global Dividend Index, dividends could grow by 5% in headline terms this year—a projection that would bring total payouts to a record high of $1.83 trillion. “Underlying growth is likely to be closer to 5.1% for the full year, as the strength of the U.S. dollar against numerous currencies slows overall growth,” the asset manager explains. However, the current environment of uncertainty and slower economic growth is prompting investment firms to reflect on what might happen with dividends this year.
BNY Investments notes that we are operating in a world undergoing deep structural changes, where inflation is likely to remain elevated and interest rates are no longer near zero. “Those ultra-low rates were a historical anomaly, a response to the financial crisis, but they do not represent the norm. As inflation persists, we should expect rates to stabilize around 3% to 5% in the long term,” says Ralph Elder, Managing Director for Iberia and Latam at BNY Investments.
In this regard, he believes this shift also has a geopolitical dimension: “We are moving from what we used to call the ‘peace dividend’ after the Cold War to a new era of rearmament. The global economy is fragmenting, shifting from globalization to regional blocs and from free trade to more protectionist policies. All of this contributes to greater uncertainty and structural inflation.”
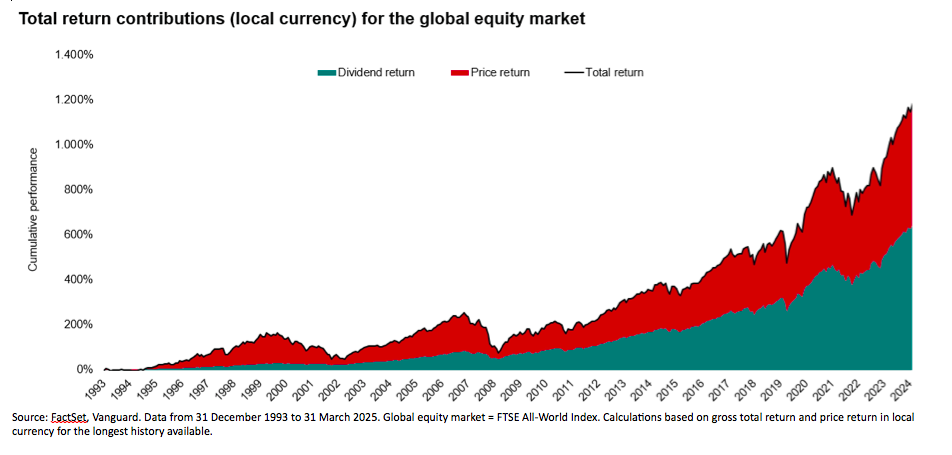
The Role of Dividends In this context, Elder recalls that dividend income has historically been the most consistent driver of total returns in equity markets, except during highly unusual periods such as quantitative easing, when artificially low interest rates distorted valuations.
“Looking at long-term data, dividend reinvestment dramatically improves outcomes. If you had invested $1 in 1900 and simply followed the market, today you would have approximately $575. But if you had reinvested dividends year after year, that figure would exceed $70,000. That is the power of the compounding effect of dividends over time,” Elder points out.
He argues that in a more volatile, inflationary world with higher interest rates, dividends can provide stability and act as a buffer. “They help smooth the investment journey and will continue to be an essential component of equity returns going forward,” he emphasizes.
This view is also shared by Viktor Nossek, Director of Investment and Product Analytics at Vanguard in Europe: “Dividends remain a fundamental component of long-term equity returns. Since 1993, the FTSE All-World Index has risen nearly 1,150%, with 586 percentage points of that increase attributable to reinvested dividends. It’s a trend that will likely gain importance, especially in a market environment with greater uncertainty and stagflationary tendencies.”
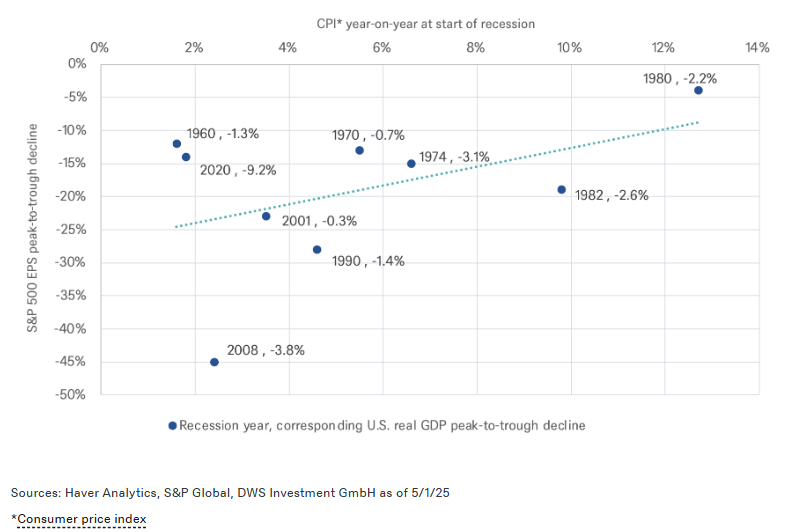
The Impact on Dividends Now then, how do recession risks affect earnings per share (EPS)? According to DWS, recessions with higher inflation rates have historically had a smaller impact on the S&P 500’s earnings per share (EPS) than deflationary recessions. Their analysis shows that the average decline in S&P 500 EPS during recessions has been 20%, from the peak to the trough of earnings over a four-quarter period, with results since 1960 ranging between 4% and 45%. The asset manager notes that although deeper recessions tend to lead to more pronounced EPS declines, the inflationary environment also plays an important role.
David Bianco, Chief Investment Officer for the Americas at DWS, notes that in recessions with inflation above 4%, the impact on S&P EPS is smaller than what would be suggested by the contraction in real GDP. “This is due not only to high inflation driving nominal sales growth but, more importantly, to the fact that—unlike during severe disinflation or deflation—recessions with high inflation can help avoid rising financing costs for the financial sector; limit losses from corporate inventory liquidations; prevent consumers from further delaying purchases in anticipation of falling prices; support commodity prices and demand for related capital goods; enable large companies to implement price increases; and limit asset write-downs that negatively affect reported EPS,” explains Bianco.
In the long term, Bianco expects S&P 500 companies to absorb about one-third of the tariffs ultimately implemented by the Trump administration, which he estimates would impact S&P net earnings by 3.5%, or approximately $10 per share. “Our revised S&P EPS forecasts for 2025 and 2026 are $260 and $285, respectively, assuming slower growth and weak output, but no deep U.S. recession or sharp decline in the value of U.S. assets. We also include a $5 foreign exchange gain in the S&P EPS, as we expect a weakening of the U.S. dollar going forward,” he concludes.
Dividends in the First Quarter In the first quarter of 2025, global dividend distribution volume reached $398 billion, representing a 9.4% increase compared to the same period the previous year. Although growth remains robust, it is significantly lower than the 15.3% rise recorded in Q4 2024.
According to Vanguard, these figures are an early indication that global uncertainties are increasingly weighing on corporate confidence, although the 12-month global dividend distribution volume remains at $2.2 trillion for the year.
“Dividend payouts in 2024 hit record levels. And although distributions continued to rise in Q1 2025, the early effects of potential tariffs are becoming evident. Declines were primarily observed in Asia-Pacific and emerging markets (excluding China); in addition, there were dividend cuts from consumer goods companies in the U.S. (down $5.8 billion year-on-year) and China (down $2.3 billion year-on-year). These losses were offset in the first quarter by dividend distributions from North American financial and technology stocks,” notes Nossek.
While Viktor Nossek, Director of Investment and Product Analytics at Vanguard in Europe, acknowledges that China will continue to drive dividend growth, North America remains the largest payer. “Globally, the dividend distribution landscape is uneven. Japan saw an 18% increase, North America 4%, the U.K. 1%, and Europe 0%. Emerging markets, excluding China, recorded growth nearly 7% lower than the previous year, while companies in the Pacific region, excluding Japan, reduced payouts by 14%. Despite China’s exceptional interim dividend, North America remains the largest dividend payer, with around $191 billion in Q1, followed by emerging markets ($74 billion), Europe ($51 billion), and China ($38 billion),” he concludes.
To shed some light on how this evolution is taking place, Capgemini has analyzed these trends through the lens of three central themes that will define the future of the industry: “customer first” – referring to customer experience – business management – focused on process transformation – and the concept of “intelligent industry” – linked to the impact of new technologies.
According to the consultancy, these themes reflect how companies in the wealth management industry are responding to the industry’s challenges and opportunities, positioning themselves to drive a customer-centric, efficient, and innovative future for wealth management. Specifically, the 10 trends identified by Capgemini’s report are:
Trend 1. Wealth Firms Strengthen Digital Platforms to Consolidate Services and Create a Seamless Customer Experience. The integration of services such as market information, personalized alerts for new releases, and the full range of portfolio products – all accessible through digital platforms – enhances visibility and convenience for clients, resulting in greater overall satisfaction. Thus, faster and smoother interactions, along with innovative portfolio creation options, help wealth firms retain clients and increase wallet share, driving growth and profitability.
Trend 2. Artificial Intelligence Can Enable Tailored Investment Advisory Strategies. AI can tailor product recommendations to individual preferences to spark engagement and build customer loyalty. This technology can help optimize tax planning strategies and provide ways to amplify returns, enhancing clients’ overall financial well-being.
Trend 3. With the Rise of Young Entrepreneurs, Wealth Management Firms Shape Their Advice to Reach HNWIs of All Ages. Wealth firms will increasingly engage with individual HNWIs. To attract these clients, they may target emerging talent, offering financial advice to young professionals navigating business with non-traditional career paths. As they progress in their careers, these individuals can become high-value clients. By understanding the unique financial needs and preferences of young entrepreneurs, wealth firms position themselves as trusted advisors and partners, driving long-term growth.
Trend 4. Wealth Firms Pursue Overseas Expansion to Broaden Services and Boost Revenue. Large wealth management firms are focusing on new wealth hubs and international markets driven by demographic and regulatory changes. They will continue merger and acquisition activity within the wealth management sector, consolidating smaller firms and regrouping larger ones with private equity firms or merging to form major companies.
Trend 5. Wealth Firms Implement ESG Asset Transparency Metrics as Regulators Standardize Sustainability Reporting. A consistent methodology for classifying raw data (carbon emissions, temperature rise) can simplify the measurement of sustainability performance, making it easier for investors to select suitable ESG assets and helping advisors explain how these investments are environmentally friendly. ESG metrics and standardized reporting enable financial services firms to transparently disclose their sustainability practices, combating greenwashing and fostering stakeholder trust.
Trend 6. Digital Onboarding Increases Wealth Firm Revenues Through White Labeling While Accelerating Client Acquisition and Enhancing Compliance. Smart automation in areas such as risk profiling, document signing, and asset transfers improves efficiency in client onboarding. White-labeled digital onboarding solutions can boost revenues for wealth firms. These firms can streamline the end-to-end journey – from prospecting to account opening – by capturing data early to power personalized value propositions, fostering stronger client relationships from the start, and offering wealth firms a comprehensive view of client needs and expectations across all life stages.
Trend 7. Wealth Firms Unify Operating Models to Provide a Consistent Experience to HNWIs Across Geographies. By streamlining operations, wealth firms can tailor services to regional trends, paving the way to bridge the gap between clients in different wealth groups and geographical areas. With a global, client-centric operating model, interactions can be simplified so clients can access the full suite of services on an international scale through a single, unified point of contact.
Trend 8. Gen AI Copilots Can Boost Relationship Managers’ Productivity. Gen AI copilots will automate time-consuming repetitive tasks, allowing relationship managers to use the saved time for more meaningful client interactions. This enables a focus on networking, building personal relationships, and fostering deeper connections. With AI copilots handling manual processes like transcription, scanning policy documents, and even suggesting potential offers or solutions, client-advisor conversations will become more efficient.
Trend 9. Real-World Asset Tokens Powered by Robust Blockchain Networks Improve Liquidity and Access. Tokenization speeds up liquidity for RWA owners such as real estate and facilitates fractional investment in high-value assets. Blockchain networks streamline the RWA token exchange process, enabling 24/7 trading with increased security of valuable assets and reduced transaction costs. The tokenization of RWAs will affect asset classes unevenly. Assets with large market sizes and fewer regulatory hurdles are likely to be adopted earlier. Less liquid assets or those with inefficient market processes will gain significant advantages from tokenization.
Trend 10. “Cloud-Native” Platforms Expand Workflows and Enable Cost-Effective Wealth Management Processes. “Cloud-native” platforms are designed with modular offerings, providing flexibility for wealth firms to scale use cases in line with their API strategy. The fast development cycles of “cloud-native” platforms versus “cloud-enabled” platforms allow for quicker adaptation to evolving market conditions and client needs. As clients and markets change, “cloud-native” platforms can scale up or down to accommodate data volumes. And the pay-as-you-go nature of this platform model supports cost efficiency.